Funafuti, Tuvalu
Funafuti, Tuvalu
City Scan
May 2025
![]()
![]()
![]()
![]()
Executive Summary
Setting the Context
Funafuti is the capital and largest atoll of Tuvalu, a small island nation in the Pacific Ocean. Geographically, Funafuti is a low-lying coral atoll, with its highest point rising only a few meters above sea level. Tuvalu’s economic growth is concentrated on the main island and within the urban area of Funafuti. The local economy of Funafuti is primarily based on subsistence farming, fishing, and government services.
Population and Demographic Trends
Funafuti’s population increased by 198% from 2,120 in 1979 to 6,320 in 2017, at an average annual rate of 2.9%. With an area of 2.79 km2, Funafuti has a population density of 2,265 people per km2, but most of its population is concentrated in an urban core.
City Competitiveness and Economic Activity
Consistent with the population distribution, the sole economic hot spot of Funafuti is located on the Fungafale Island. The economic activities around the population center on Fungafale have seen some moderate growth in recent years, but those around the Tuvalu Port have declined slightly.
Built Form
Water bodies, grassland, and tree cover are the major surface cover classes in Funafuti. Built-up areas, mainly in the east, make up only 0.8% of surface cover. The road network is concentrated on the Fungafale Island, as is community infrastructure such as schools and healthcare facilities.
Climate Conditions
Surface temperatures in Funafuti demonstrate the Urban Heat Island (UHI) effect, though the average surface temperatures are moderate overall, ranging from 22 to 27 degrees Celsius. There are green spaces on Fungafale Island that exist in close proximity with the population center. Solar power potential in Funafuti is moderate, but the seasonality is very low, making solar electricity more feasible. There are no data on PM2.5 concentration in Funafuti, nor is there any forest cover.
Risk Identification
The primary hazard confronting Funafuti is sea level rise. Nearly all of Funafuti, except very limited areas on the Fungafale Island, is already being impacted by sea level rise. However, sea level rise flood zones in 2050 and 2100 are not projected to grow beyond the flood zones in 2020. Tsunamis, drought and cyclones are all risks for Funafuti. Since 1980 59 cyclones have passed near Funafuti. Earthquakes and landslides do not pose a significant threat to Funafuti.
Local Institutions and Planning
Funafuti is governed by the Funafuti Town Council which is responsible for the overall administration and development of the capital. The distribution of national government funds to island councils is determined through recommendations put forth by the Minister of Home Affairs. Several national strategies guide the sustainable development of Tuvalu. Despite these efforts, planning in Tuvalu is not well developed, and faces challenges including lack of institutional capacity and limited resources.Setting the Context
Basic City Information
Funafuti, the capital and largest atoll of Tuvalu, a small island nation in the Pacific Ocean, is characterized by a collection of islets and reef islands forming a lagoon, with Funafuti serving as the primary island where the capital is located. Geographically, Funafuti is a low-lying coral atoll, with its highest point rising only a few meters above sea level. The islets are composed of coral and sand, and the surrounding waters are rich in marine life.
Similar to many Pacific Island countries, Tuvalu’s economic growth is concentrated on the main island and within the urban area of Funafuti. The local economy of Funafuti is primarily based on subsistence farming, fishing, and government services. Funafuti is home to the country’s government offices, educational institutions, and other administrative facilities generating employment opportunities for the local population. Additionally, tourism, though relatively limited, plays a small but growing role.
However, Tuvalu’s economy is highly vulnerable to external factors, such as fluctuations in commodity export prices, due to its reliance on foreign imports. Additionally, the country faces increased vulnerability to natural hazards, particularly rising sea levels and more frequent and intense storms, which are expected to worsen in the near future. Today, efforts are being made to tackle these risks, minimize their effects, and develop sustainable strategies that prioritize the well-being of Funafuti’s residents and safeguard the country’s unique environment.
The boundary lines mark the area of interest for the City Scan. These lines may differ from the city’s official administrative boundaries and may include multiple jurisdictions.
Population and Demographic Trends
Population Density
- Funafuti’s population is concentrated on the Fungafale Island on the eastern side of the atoll
- Some low-density population clusters also exist in the rest of the atoll
This map estimates population numbers per 10,000 m2 grid cell. It provides a more consistent representation of population distributions across different landscapes than administrative unit counts. Knowing where people are is critical for impact assessments and intervention plans, especially those focused on service delivery, food security, climate change, network systems and natural disasters.
Population Growth
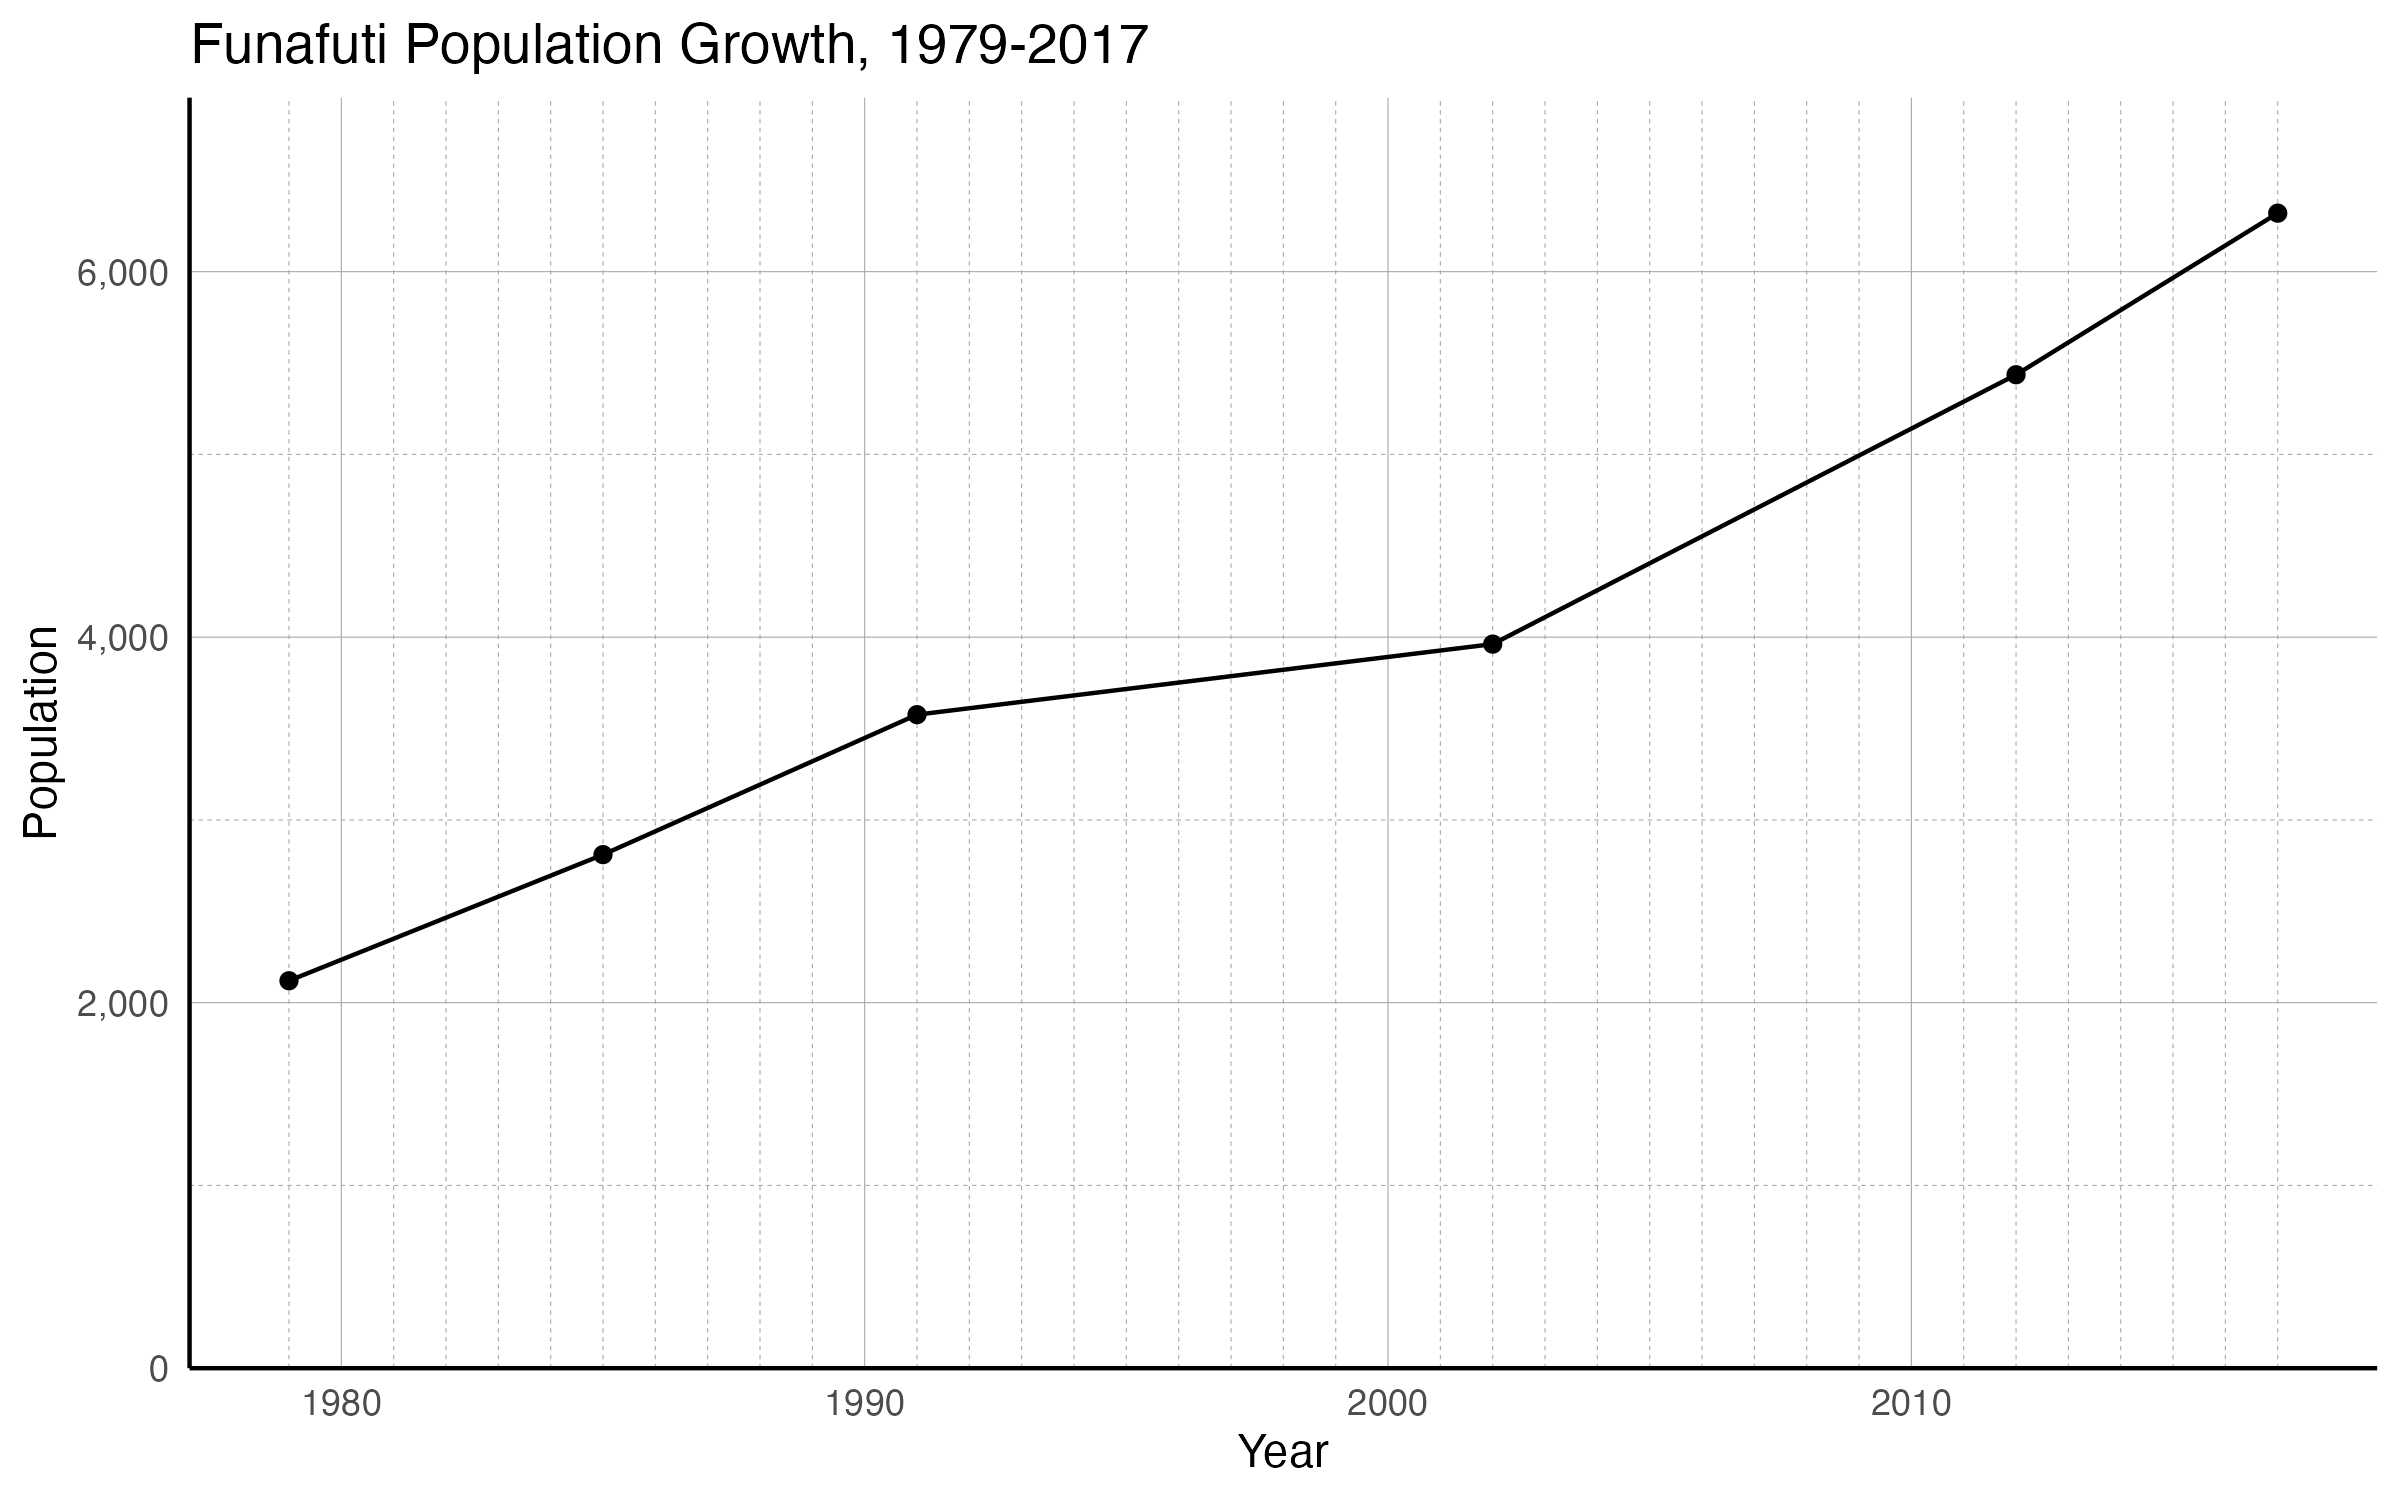
- Funafuti’s population increased by 198% from 2,120 in 1979 to 6,320 in 2017, at an average annual rate of 2.9%
- Growth was fastest in the 1980s and in the 21st century
Population figures are typically used as a denominator for many indicators, and are a measure of demand for services. The line chart above summarizes the city’s population change according to census and other public data. High growth of urban populations, caused by rates of natural increase (more births than deaths) in urban areas, migration from rural to urban areas, and the transformation of rural settlements into urban places, puts pressure on cities to meet the new demand.
Population Density
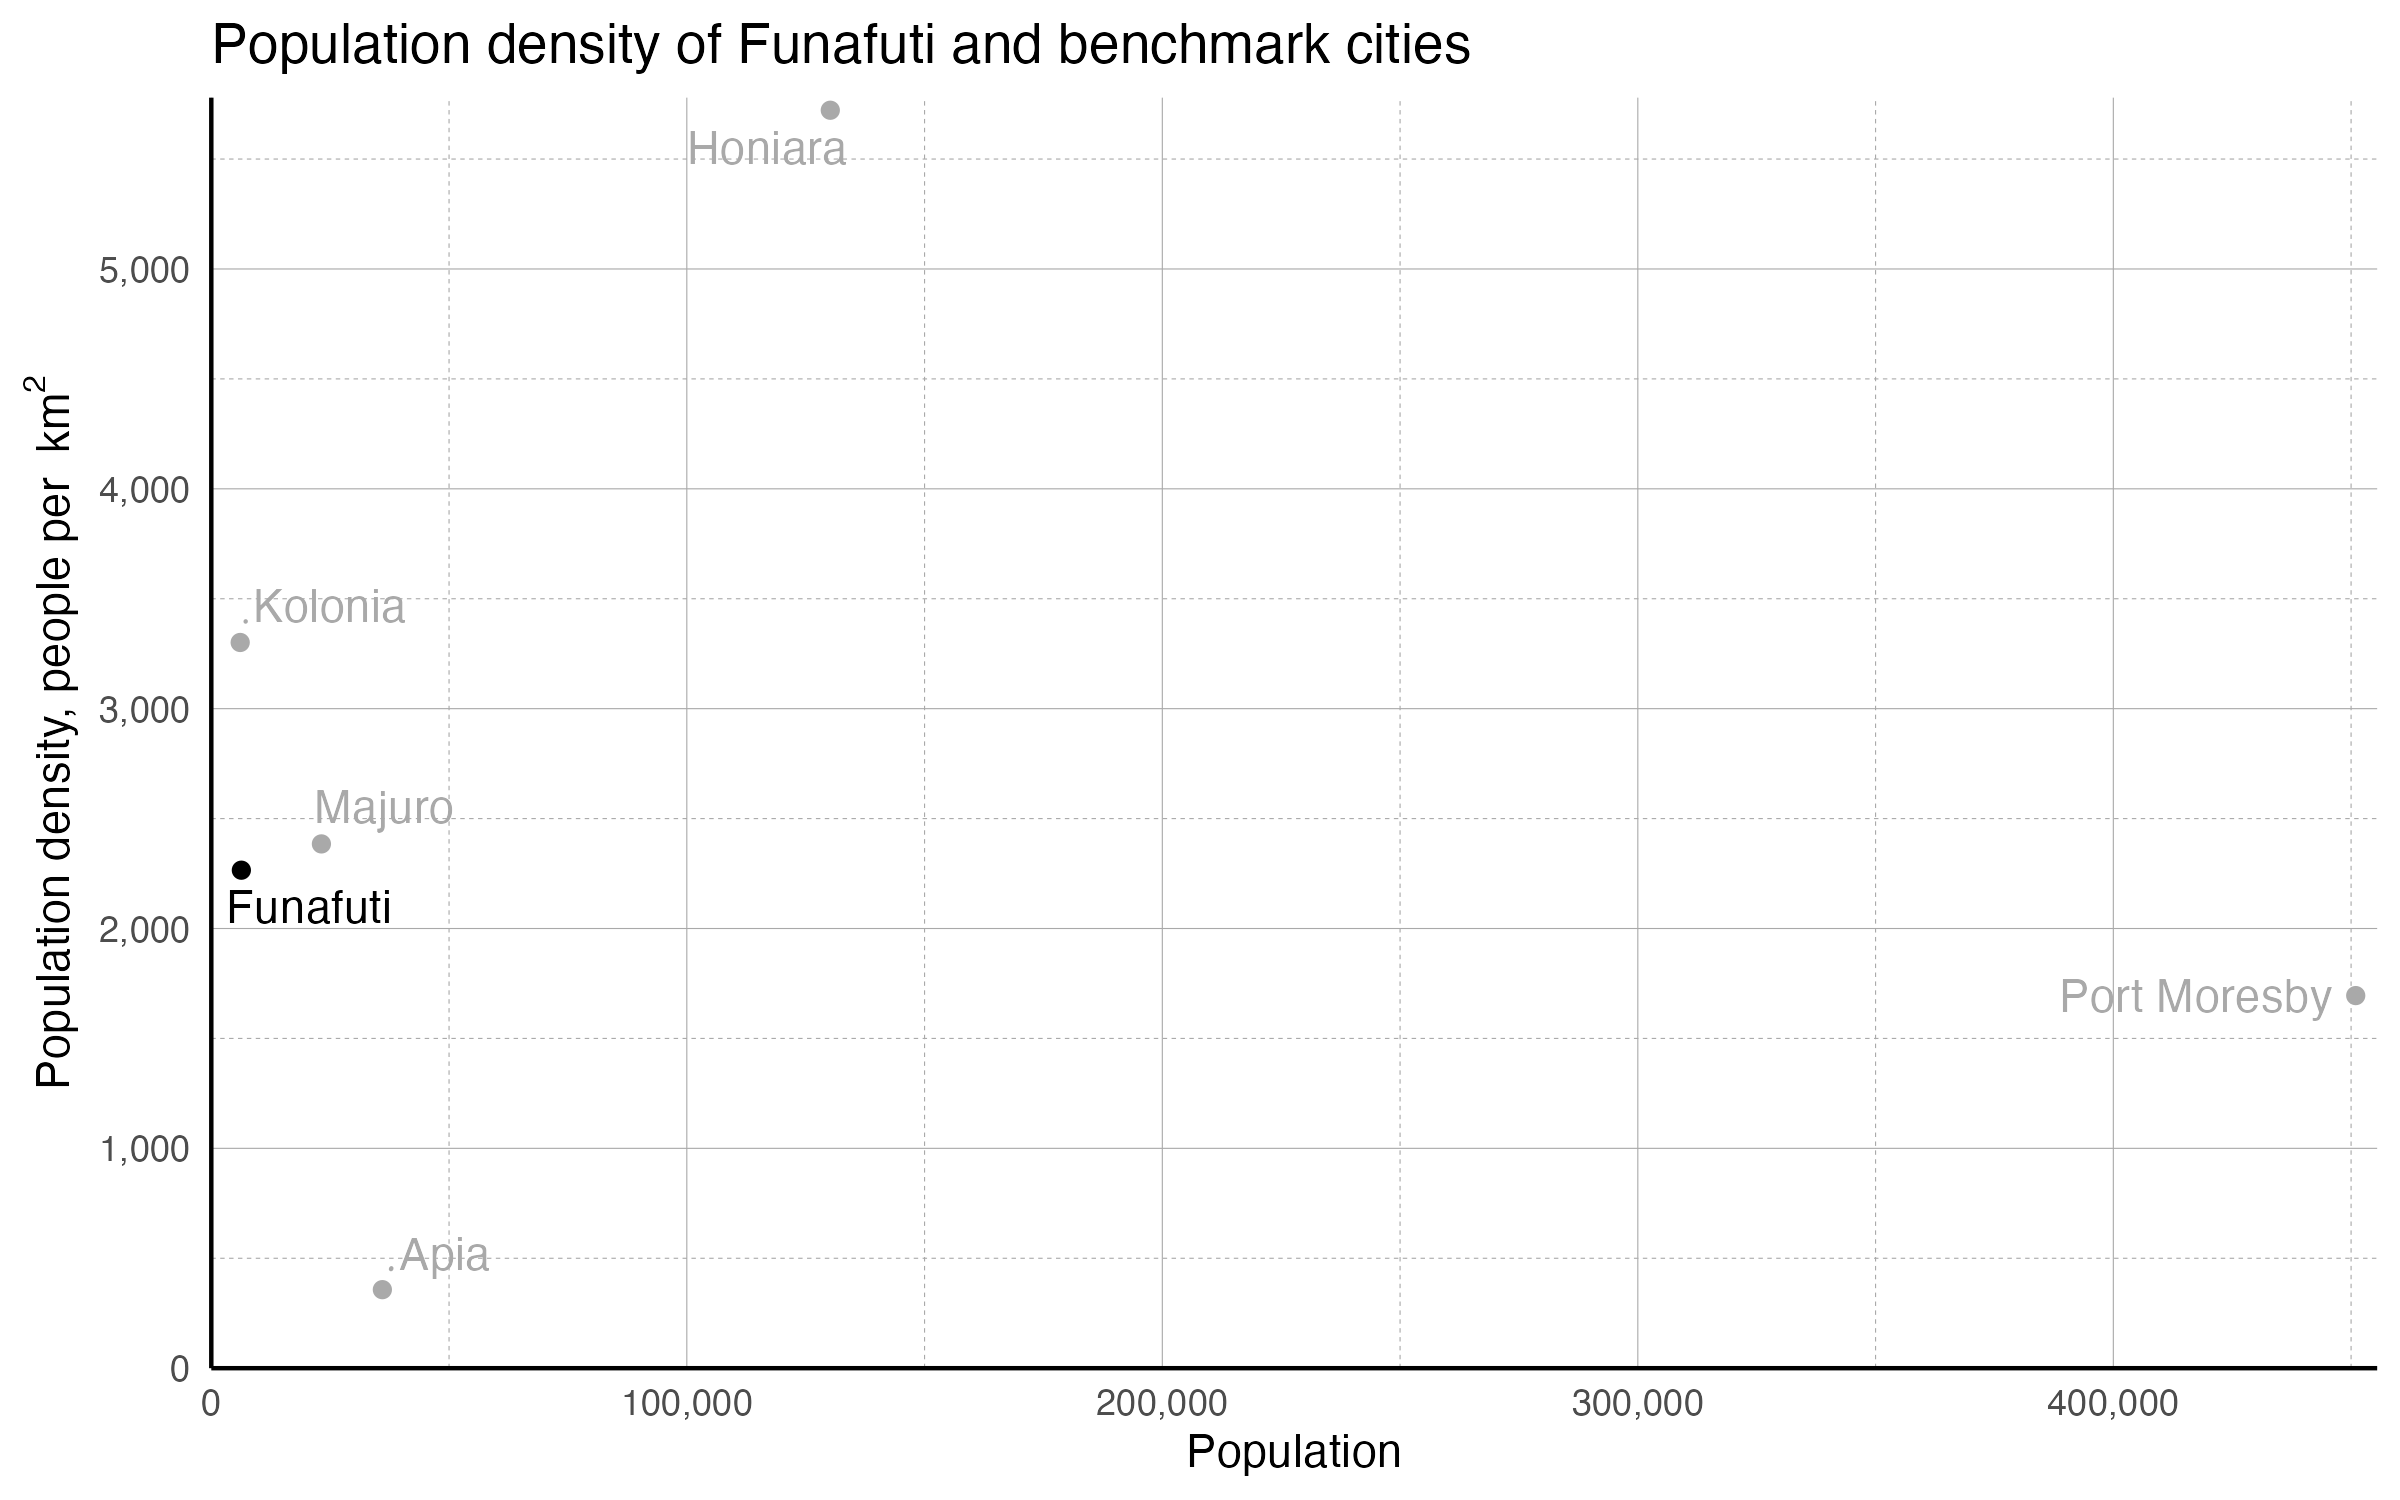
- With an area of 2.79 km², Funafuti has a population density of 2,265 people per km²
- Among the 5 regional benchmark cities, Funafuti has the 3rd highest density
Density is calculated using the most recent census population recorded and the official land area occupied by the city, and is an important measure of how cities function. Higher population density enables governments to more easily deliver essential infrastructure and services in urban areas at relatively low cost per capita. However, such benefits do not materialize automatically or inevitably. Whether a city’s population dynamics pose challenges or offer opportunities typically depends on the policies in play.
Populations and area are from Oxford, 2022, “Oxford Economics” or CityPopulation.de. Note that Oxford Economics uses quite large extents for its cities, meaning that the measured density is likely considerably lower than the density experienced by most inhabitants of the cities. Extents used by the both data sources may differ from the AOIs used by the City Scans.
Population Distribution by Age & Sex
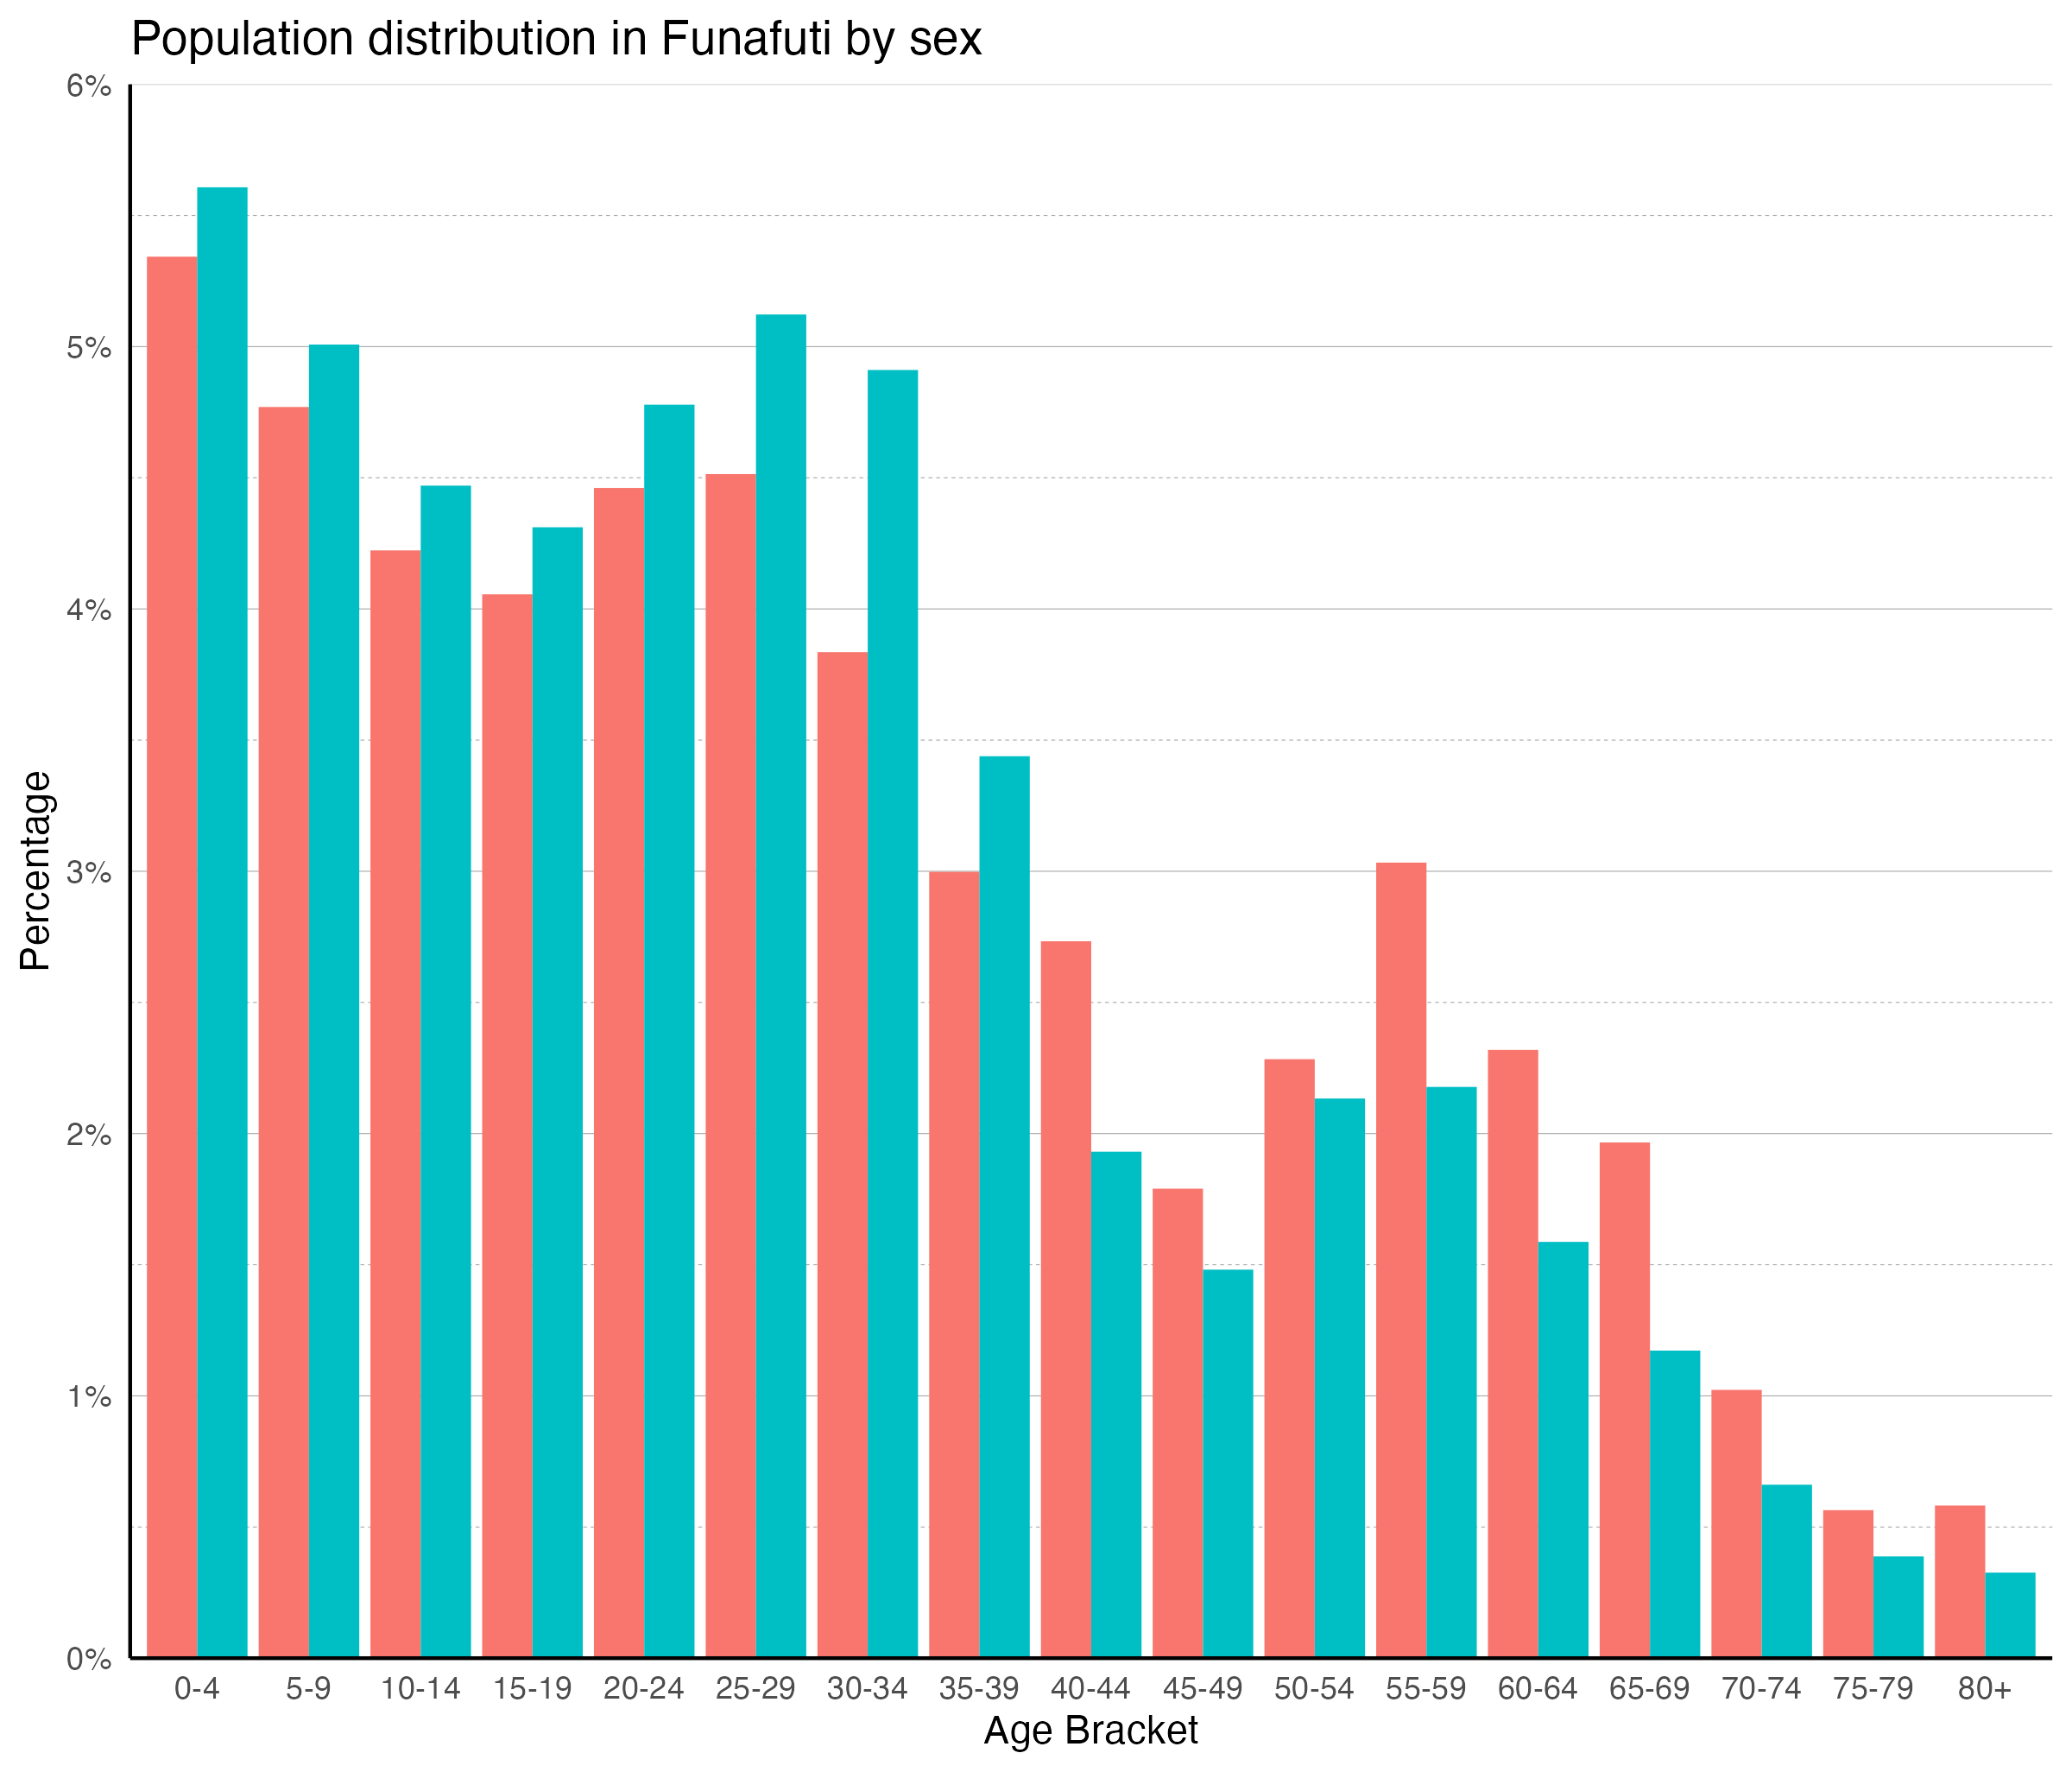
- More than half of the population is under 30
- 18% of the population are youth (15–24)
- The median female in Funafuti is older than the median male
- The largest age groups for both males and females are ages 0–4
- There is a peak for men at ages 25-34 and for women at 55-59
- Men and women are fairly evenly represented: there are 98 men to every 100 women
- 48% of all women in Funafuti are of reproductive age
This column chart classifies the city’s population according to age group, forming the basis of population projections. Populations vary significantly in their proportions of young and old people, with growing populations generally appearing younger, and declining or slowly growing populations generally appearing older.
Data from WorldPop. Bondarenko, et al, Estimates of total number of people per grid square broken down by gender and age groupings for 51 countries across sub-Saharan Africa in 2020 using Ecopia.AI and Maxar Technologies building footprints, 2020.
Reproductive age is defined as 15–49. Working age is defined as 15–64.
Economic Activity
Economic Hotspots
- Consistent with the population distribution, the sole economic hot spot of Funafuti is located on the Fungafale Island
This map measures the total emissions of nighttime lights from the monthly average of radiance for 2014 through 2022. Nighttime light radiance is a common proxy for economic activity: where there is more artificial light, there is generally more commercial activity. VIIRS observations are made fairly late at night, as its satellites cross the equator at around 1:30 local time; thus, the observed lights are typically street lights and nights which are left lit all night long. The correlation of nighttime light and economic activity is strongest for urban areas; it is less relevant in agricultural areas and areas with very low population density.
Map data from NOAA, “VIIRS Daily Mosaic”.
Change in Economic Hotspots
- The economic activities around the population center on Fungafale have seen some moderate growth in recent years, but those around the Tuvalu Port have declined slightly
The map illustrates monthly temporal changes from 2014 to 2022 in the emission of nighttime lights, indicating changes in economic activity. Positive values represent an increase in the intensity of nighttime light emission and, by proxy, economic activity, while negative values represent a decrease in the intensity of nighttime light emission, and economic activity.
Map data from NOAA, “VIIRS Daily Mosaic”.
Built Form
Intersection Density
Intersection density is a measure of network compactness, conveying information about street connectivity. The amount and types of intersections in a road network help determine how a local community functions and the character of the streets themselves. In a good street network, most streets should connect at both ends. A high level of connectivity provides an efficient platform for dispersing traffic, facilitating route choice, and creating more comfortable conditions for people who travel by foot, bike, or transit.
Map data from OpenStreetMap.
Land Cover
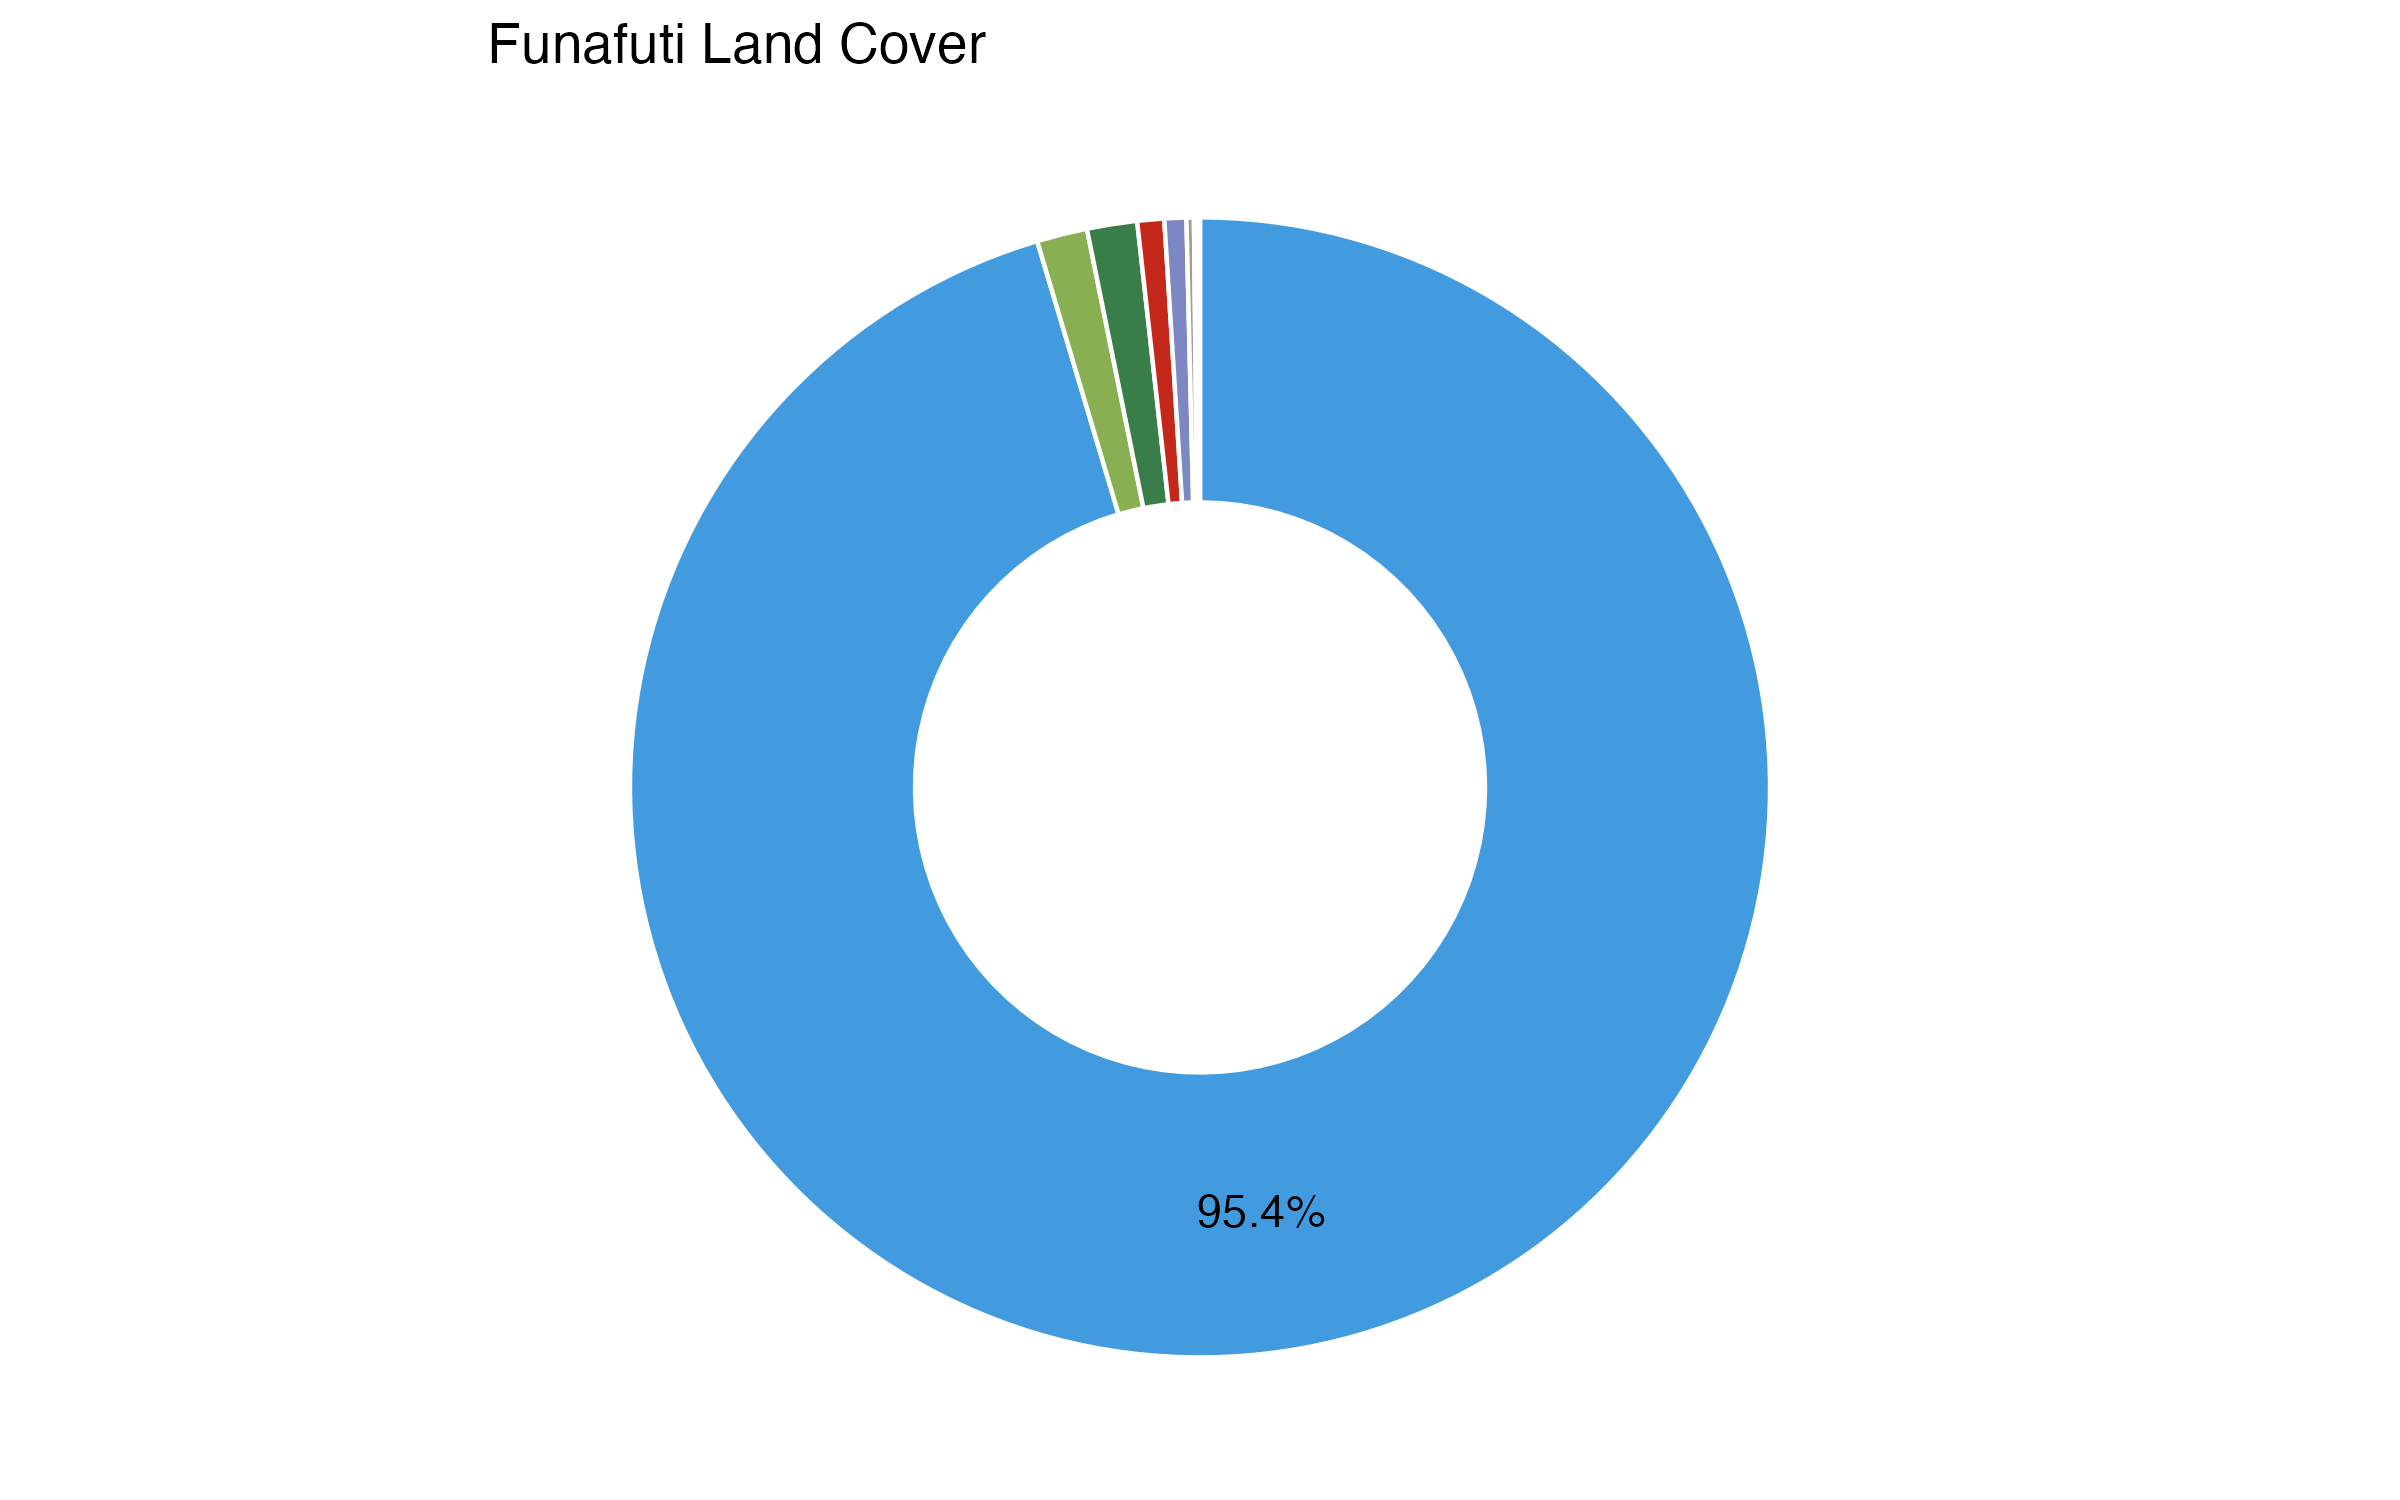
- Water bodies comprise the majority of land in the Funafuti area of interest (95.4%)
- Next to water bodies, grassland (30% of non-water area) and tree cover (30%) are the largest land classes
- Built-up areas, mainly in the east, make up 17% of non-water area
Land cover refers to the ground surface cover, including vegetation, urban infrastructure, water, and bare soil, among other classifications. Identifying land cover type helps to understand land utilization and inform planning policies and programs.
© ESA WorldCover project 2020 / Contains modified Copernicus Sentinel data (2020) processed by ESA WorldCover consortium’
Access to Schools
- The three schools in Funafuti are all situated on the Fungafale Island, and two of them are in the population center
- There may be other schools in Funafuti which are not documented on OpenStreetMap
- The accessibility analysis only considers land transport. Therefore, it is difficult to determine the level of access to schools amo
Using a proximity analysis along the existing road network, this map identifies the areas that are most- and least-accessible to schools. The analysis includes all facilities classified in OpenStreetMap as a school, kindergarten, college or university. Note that there may be more schools that are not included in OpenStreetMap.
Map data from OpenStreetMap and DLR, 2015.
Access to Health Facilities
- The only health facility is located on the Fungafale Island, along the major road
- The accessibility analysis only considers land transport. Therefore, it is difficult to determine the level of access to schools among residents on the smaller islands
Using a proximity analysis along the existing road network, this map identifies the areas that are most- and least-accessible to schools. The analysis includes all facilities classified in OpenStreetMap as a health amenity, clinic, or hospital. Note that there may be more health facilities that are not included in OpenStreetMap.
Map data from OpenStreetMap and DLR, 2015.
Climate Conditions
Solar Photovoltaic Potential
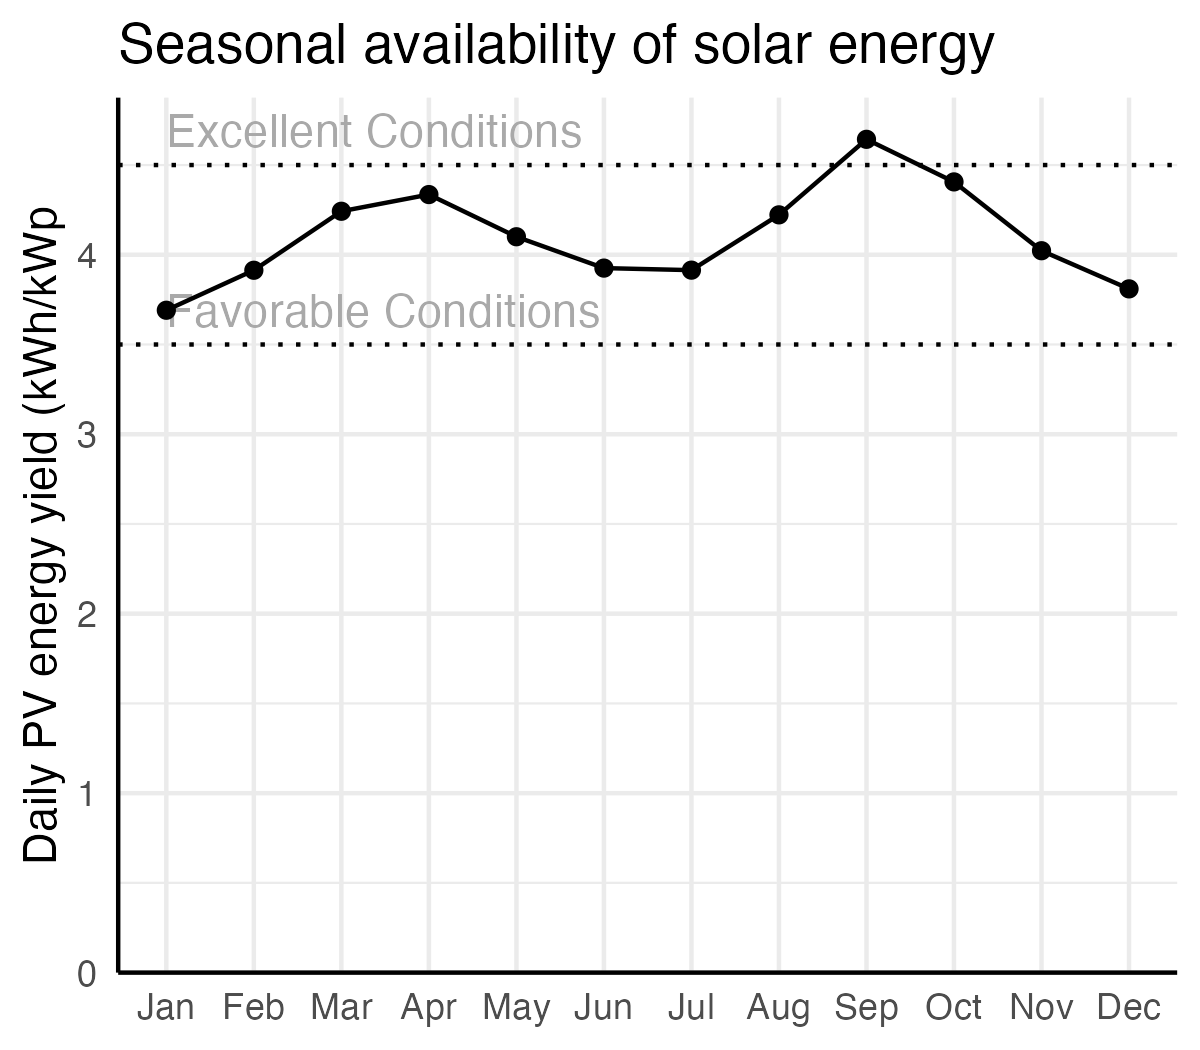
- PV power potential in Funafuti is moderate (1,495–1,502 kWh/kWp annually)
- But seasonality is very low, with favorable conditions in every month, which makes solar electricity more feasible
- Solar power is most available in the north
Solar electricity offers a unique opportunity to achieve long-term energy sustainability goals. Photovoltaics (PV) is the most widely applied and versatile technology for solar power. The availability of solar energy depends on site conditions. This map displays an indicative estimate of daily specific yield, that is, how much energy a hypothetical PV system would produce for per unit of capacity (kWh/kWp). Values above 4.5 are considered excellent availability, while values between 3.5 and 4.5 are moderate.
Map data obtained from the “Global Solar Atlas 2.0, a free, web-based application is developed and operated by the company Solargis s.r.o. on behalf of the World Bank Group, utilizing Solargis data, with funding provided by the Energy Sector Management Assistance Program (ESMAP). For additional information: https://globalsolaratlas.info
The Global Solar Atlas uses generalized theoretical settings for a quick assessment of PV power potential for a selected site. An optimum tilt angle of PV modules and 100% availability (no shutdowns due to failure) are assumed.
Vegetated Areas
- There are green spaces across the various islands in Funafuti, including the populous Fungafale Island
- Green spaces on Fungafale Island exist in close proximity with the population center
- This vegetation is only moderately dense and, according to the land cover map, likely mostly consists of grass with some tree cover.
This map displays the Normalized Difference Vegetation Index, which ranges between -1 and 1, with higher numbers indicating a higher density of green vegetation. Values of less than 0.1 typically indicate water, rock, and otherwise barren land; values of 0.1 to 0.3 are associated with shrubs and grassland; 0.3 to 0.5 corresponds to moderate vegetation; and values of more than 0.5 correspond to dense vegetation such as forests or mature crops.
Vegetation and green spaces in cities are associated with health benefits and the mitigation of environmental risks. More green space in a city can reduce temperatures and the urban heat island effect, lessen air pollution, and absorb floodwaters. Green spaces can also serve important civic, social, and quality of life functions.
Map data from European Space Agency, 2020, “Normalized Difference Vegetation Index”.
NDVI-based measures do not account for the proximity and spatial arrangement of green spaces within areal units. They also do not address the vertical dimension and density of green urban buildup.
Risk Identification
Elevation
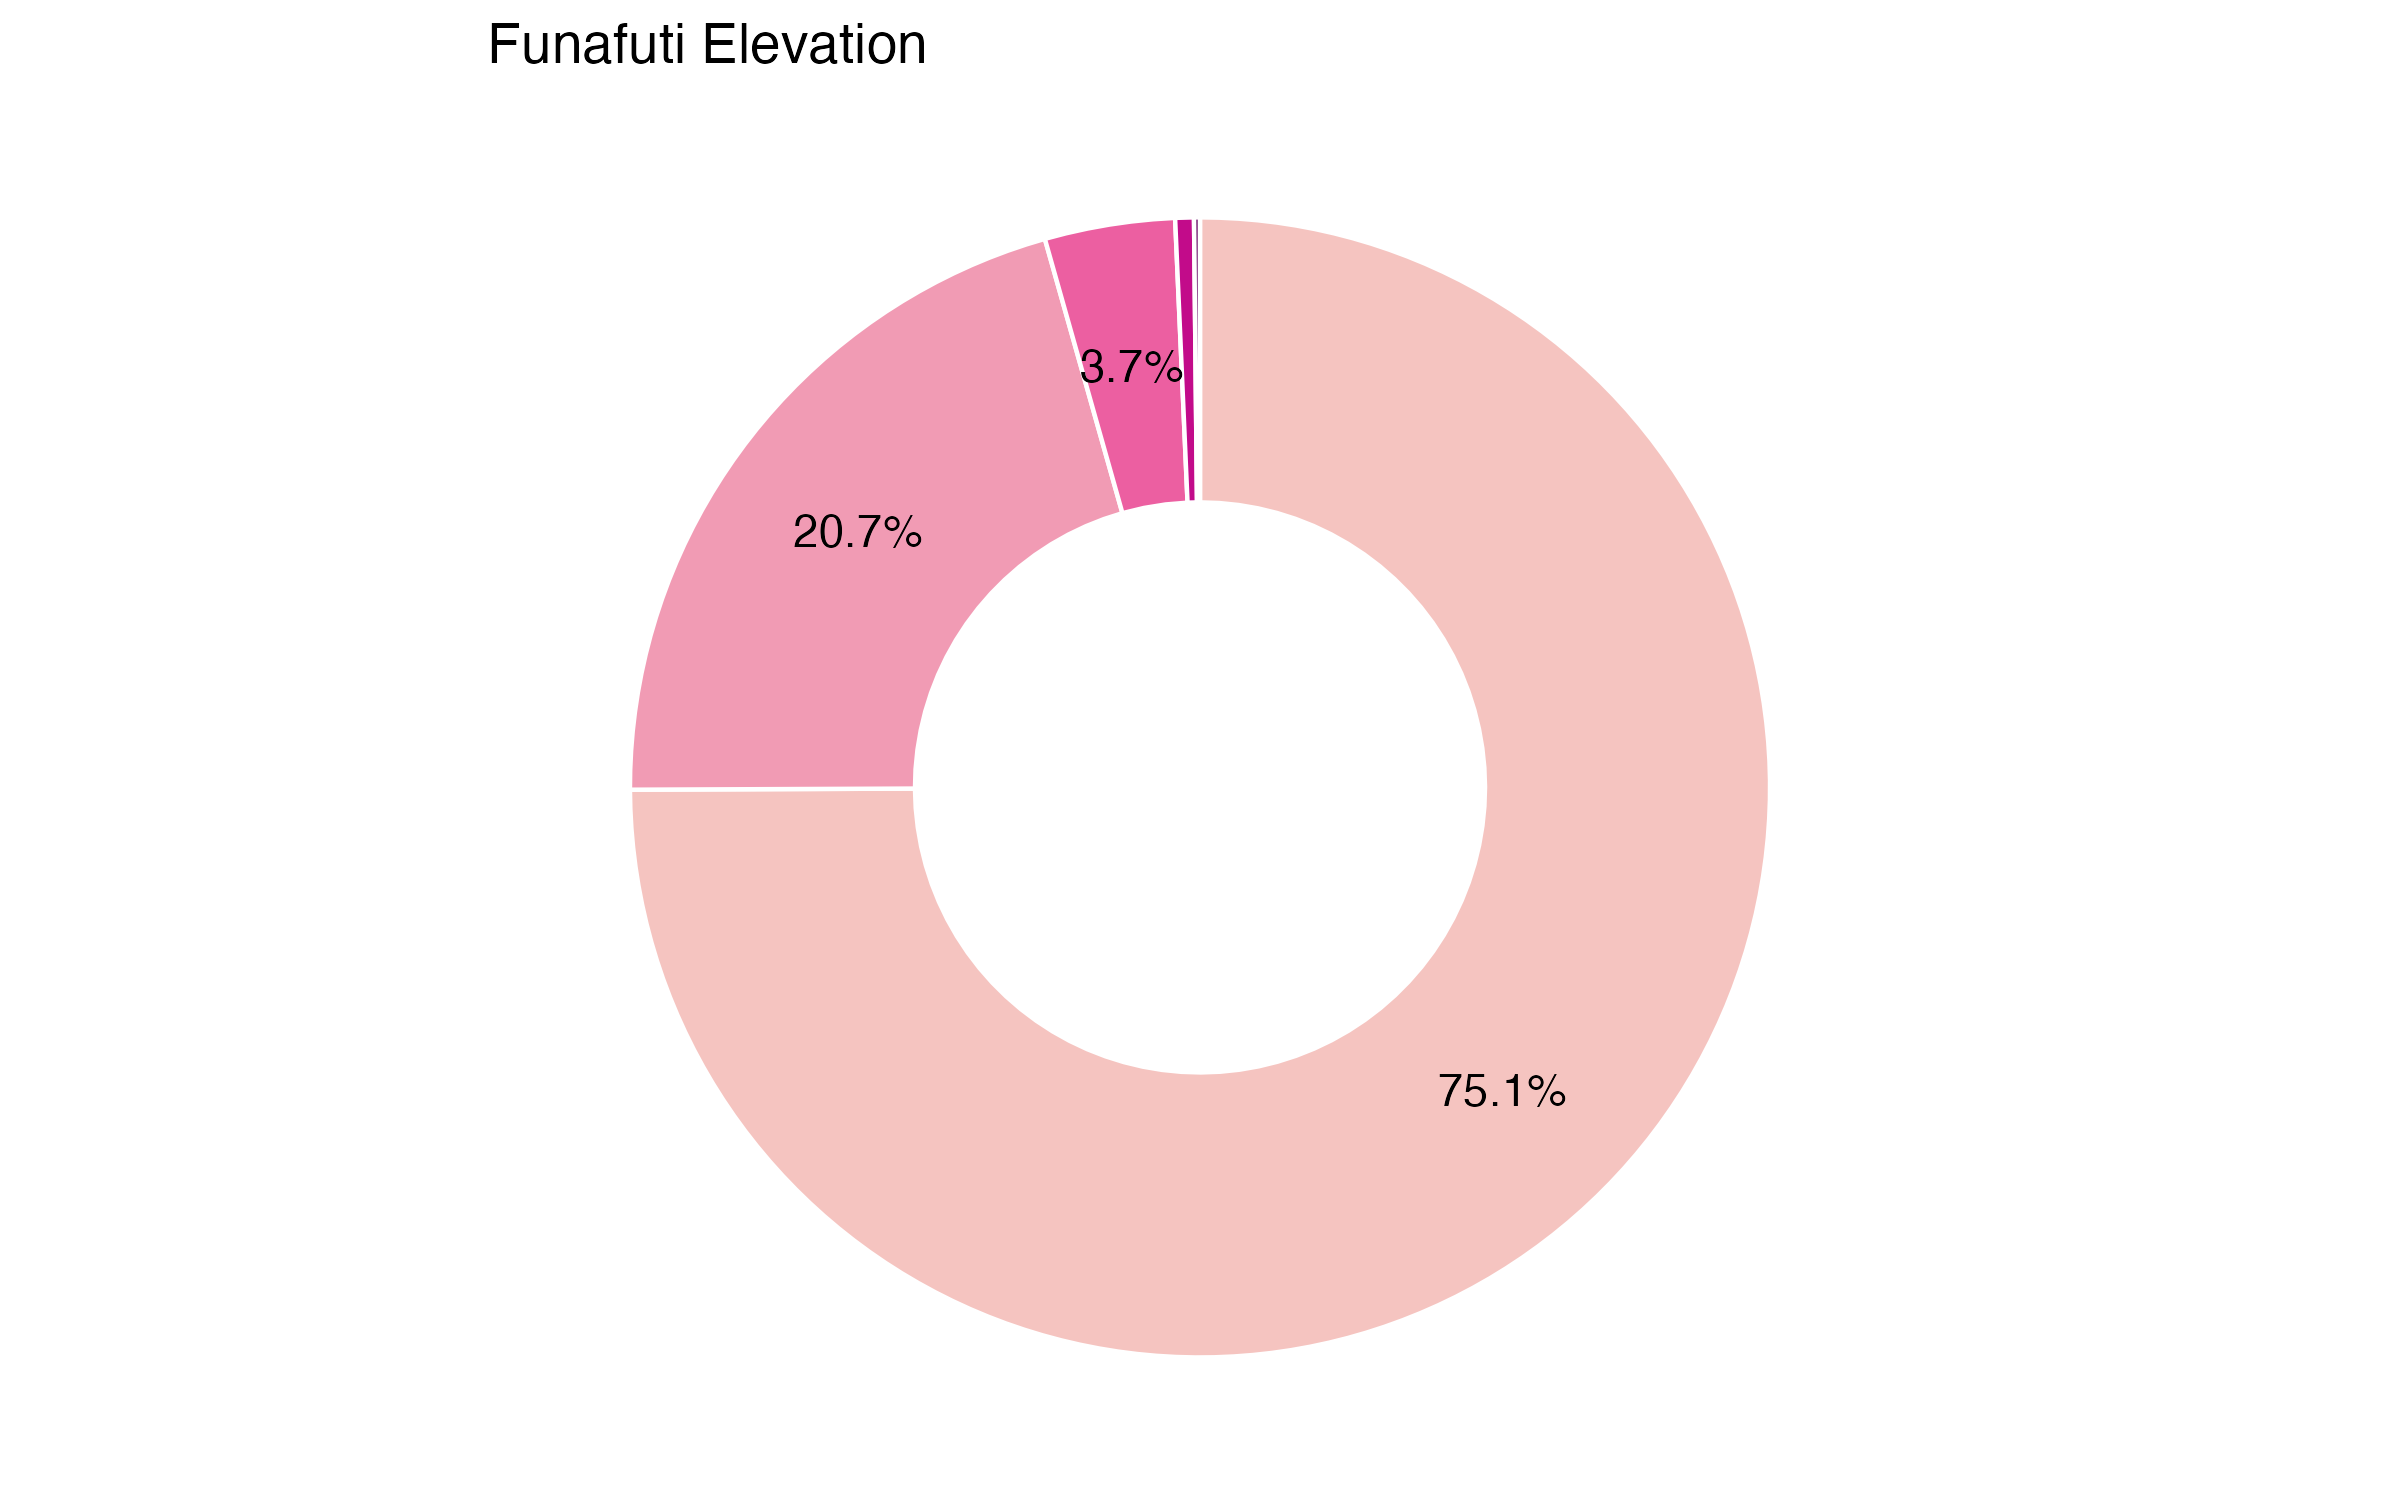
- Fungafale Island is low-lying, rendering the inhabitants vulnerable to sea level rise
- Most of the widest part of the island is less than 1.5 MASL
- The western coast of this area rises to 3 MASL, while a small part of the eastern coast rises to 4.5 MASL
- The highest point is in the north, near the high school, at 5.5 MASL
- The southwestern tip is similarly a high point, at just under 5 MASL
- Other small and sparsely populated islands have higher elevations, but even the highest point in Funafuti is only 10 MASL
Elevation informs an area’s vulnerability to many natural disasters. The height at which infrastructure, resources, and communities sit relative to normal water levels and tides, flood waters, and storm surges and waves informs their exposure. Elevation information is critical for communities to anticipate the impacts of disasters and to prepare resilient and cost-effective response and redevelopment strategies.
Map data from FABDEM V1-2.
Slope
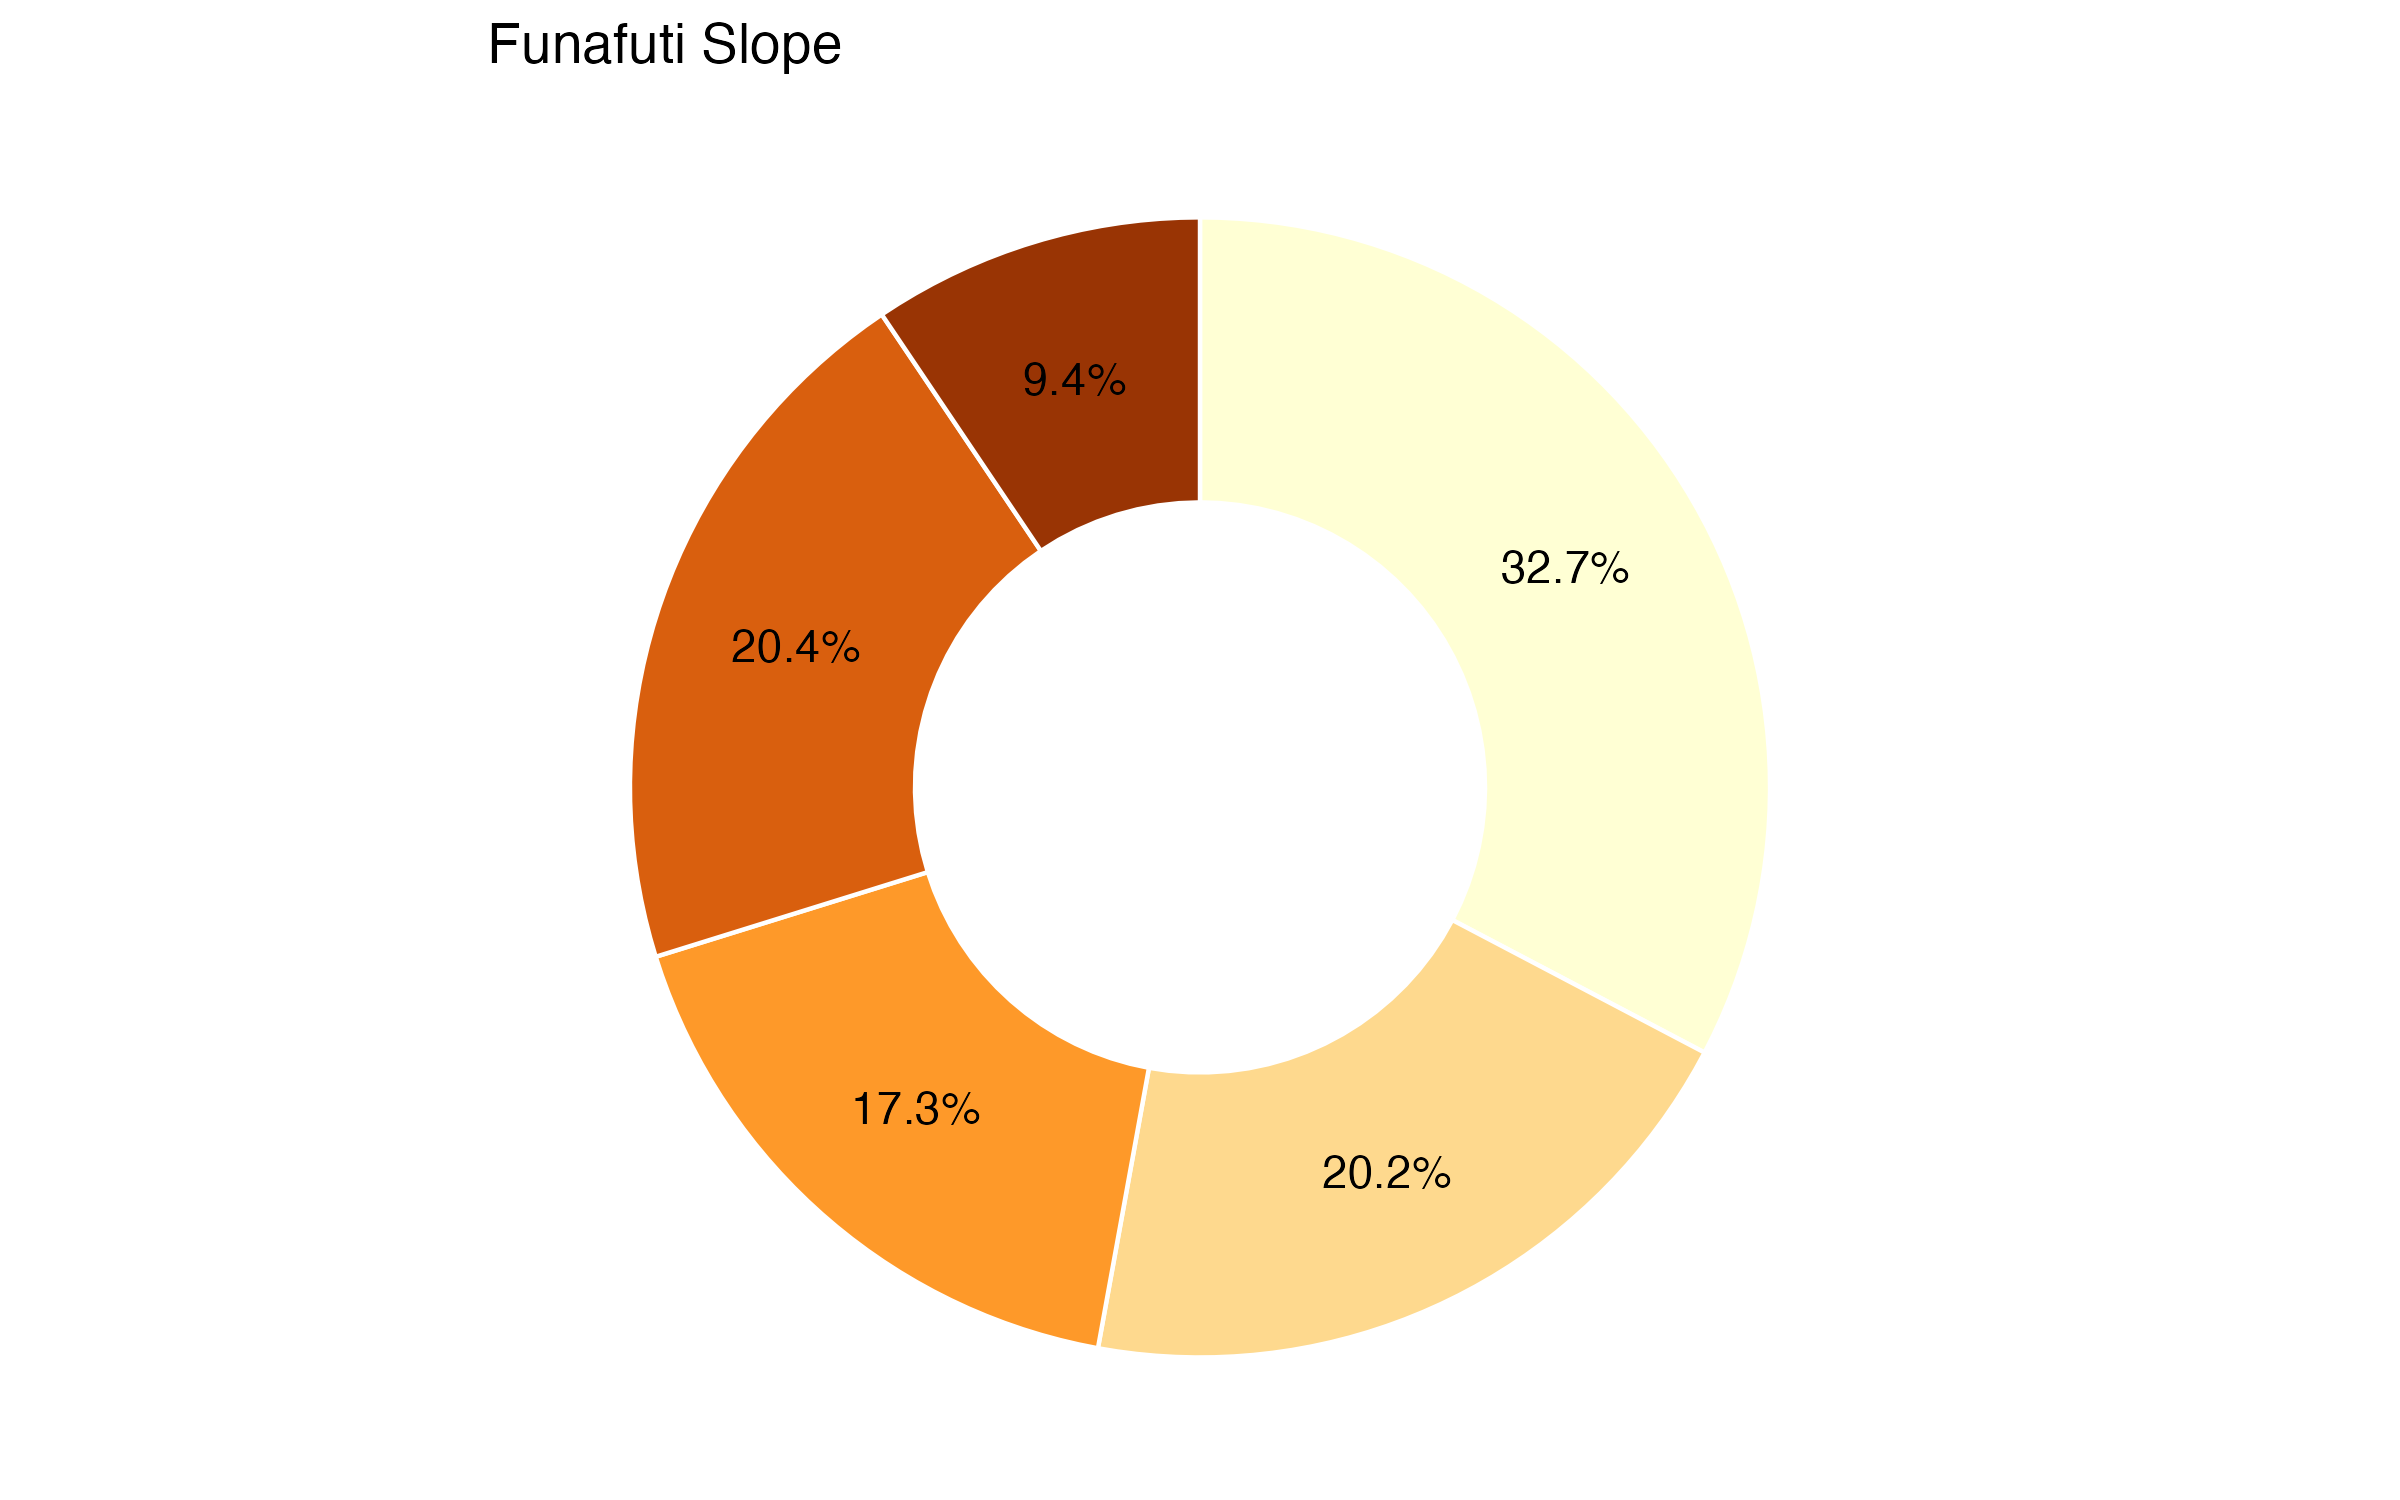
- The populated core is fairly flat, with a slope of 0-5°
- The smaller islands have steeper areas, where the slope exceeds 5°
Slope refers to the percentage change in elevation over a certain distance. In hilly or mountainous areas, floods can occur within minutes after heavy rains, while in flat areas, floodwaters can remain for days. Considering the slope of land is important in reducing construction costs, extending services and public facilities, minimizing the risks of hazards like flooding and landslides, and mitigating the impacts of development on natural resources.
Map data from USGS, 2015, “USGS EROS Archive - Digital Elevation”.
Landslides
- Landslide susceptibility is very low in the population center of Funafuti, and rises slightly to low on certain islands
This indicator refers to the likelihood that a landslide will occur in a particular area based on local terrain conditions. It shows the degree to which a terrain can be affected by slope movements, i.e., an estimate of “where” landslides are likely to occur. Susceptibility does not, however, consider the temporal probability of failure (i.e., when or how frequently landslides occur), nor the magnitude of the expected landslide (i.e., how large or destructive the failure will be).
This map combines satellite observations of rainfall with an assessment of the underlying susceptibility of the terrain. Steep slopes are the most important factor in a landscape’s susceptibility to landslides. Others include deforestation, presence of roads, strength of the bedrock and soils, and location of fault lines.
Map data from NASA, “Landslide Susceptibility Map”.
Liquefaction
- Funafuti has a very low susceptibility to liquefaction
While all of the city has the same likelihood of seismic activity, areas within a city will typically have differing levels of vulnerability, due to factors such as soil and building construction. Liquefaction is a phenomenon where loosely packed or waterlogged sediments, particularly beneath buildings and under structures, lose their strength in response to strong ground shaking. Liquefaction in the event of an earthquake can cause increased damages.
This map calculates the likelihood of liquefaction using a combination of indicators such as peak ground velocity, precipitation and others. Each level determines a threshold of confidence regarding the probability of liquefaction in the particular pixel area.
Map data from Zorn & Koks, 2019.
roads
- The streets running north-south in the populated core on Fungafale Island are the most critical segments in Funafuti
- Segments in red are most critical
This layer visualizes an approximation of road network criticality. It highlights segments within a road network that, if blocked due to flooding or other hazards, would cause a high degree of disruption to travel across the city. Segments in red are the most critical for the overall connectivity of the city.
Note that cities vary substantially in their probability of disruption due to failure of a small number of road segments; for example, when a street network follows a grid pattern or has many alternative routes between destinations, the risk of disruption owing to the failure of key road segments is lower. In contrast, other cities have particular road segments whose failure would affect a large proportion of journeys across the city.
Map data from OpenStreetMap.
Criticality is measured by calculating betweenness for each segment. Betweenness for a segment is calculated by mapping the shortest path from each intersection to every other intersection, and then taking the percentage of all trips that use that segment.
Burnable Area
- The land cover types in sourthern Funafuti are moderately burnable
This layer visualizes the burnability factor of each land cover classification, based on assigning a binned weighting factor to represent burnability of each land classification. As per Four Twenty Seven’s research and Gannon and Steinberg’s (2021) research, global trends in historical wildfire intensity and occurrence of wildfire in each land cover classification is converted into a single burnability factor.
© ESA Land Cover CCI 2020/ Gannon et.al 2021
Local Institutions & Planning
Administrative Structure
- Funafuti is governed by the Funafuti Town Council which is responsible for the overall administration and development of the capital;
- The President is the administrative head of the Funafuti Town Council, who is indirectly elected by its councilors;
- The council has the authority to establish multiple committees as required, including standing committees dedicated to health, agriculture and fisheries, education, communication, transportation and infrastructure, as well as budget and appropriations;
- Each Kaupule enforces and collects various user rates, licenses, and taxes, including a head tax and land tax;
- The distribution of national government funds to island councils is determined through recommendations put forth by the Minister of Home Affairs.
Availability Of Development Plans And Policies
- Tuvalu’s medium-term development strategy is guided by its National Strategy for Sustainable Development 2021-2030, which replaces the former national development plan from 2016-2020
- Both plans align with the goals of the UN Sustainable Development Agenda, placing significant emphasis on addressing climate change through measures aimed at both adaptation and mitigation
- Tuvalu has implemented a legal and institutional framework for urban planning at the local level through The Falekaupule Act 2008, which requires each Kaupule to create its own local development plan
- The “Funafuti Island Strategic Plan 2021-2024” (Moeakiga o Malefatuga III) aims to enhance the well-being of the Funafuti community while addressing the long-term effects of climate change
- Despite these efforts, planning in Tuvalu is not well developed, and faces challenges including lack of institutional capacity and limited resources
The State of Urban Infrastructure and Service Delivery
Land Administration
Tuvalu’s land tenure system, similar to many other small island developing states, is primarily rooted in customary practices and traditional ownership, with less than 5% of land owned by the State. In this system, land is collectively owned by clans or families, and the rights to use and occupy specific areas are passed down through generations. The management and regulation of land-related matters in Tuvalu are mainly overseen by the Lands and Survey Department. This department assumes responsibility for maintaining records and registers of land ownership and transactions, including leases and transfers. Moreover, they offer services such as surveying, land mapping, and land valuation. In the event of land disputes and conflicts, Tuvalu relies on traditional customary mechanisms involving community leaders and elders to facilitate resolution. These mechanisms prioritize consensus-building and mediation rather than formal legal processes.
Housing
The housing sector in Tuvalu faces several challenges, primarily driven by the high demand for affordable housing and a lack of suitable housing options. Tuvalu’s fast-paced urbanization has fueled the demand for affordable housing, where many low- and middle-income residents live. However, the scarcity of available land, combined with complex land acquisition processes, has resulted in a shortage of suitable homes and the continued growth of informal settlements. This expansion of informal settlements, occurring alongside urban growth, exacerbates vulnerability as houses are constructed on land highly susceptible to natural disasters. Furthermore, in Funafuti, government-subsidized housing dominates over 50% of the rental market, constituting more than 40% of the total permanent housing. This artificially inflates the rental market and restricts opportunities for private real estate development. To address some of these challenges, the government has embarked upon significant land reclamation projects in recent years. These projects aim to augment the housing supply while also serving as a means of climate adaptation.
Energy
In recent years, Tuvalu has made significant strides in the development of its energy sector, with a strong emphasis on reducing reliance on fossil fuels and transitioning to renewable energy sources. This strategic shift is aimed at meeting the country’s energy demands, fostering sustainable development, and mitigating the adverse effects of climate change. Previously, Tuvalu heavily depended on imported fossil fuels to generate electricity. However, the Tuvalu Electricity Corporation (TEC), the government-owned utility responsible for supplying electricity nationwide, has undertaken substantial initiatives to diversify the energy mix and boost the proportion of renewable energy. One notable initiative is the implementation of the “Powering Tuvalu with Renewable Resources” vision by the TEC. This vision aligns with the Tuvalu Government’s target of achieving 100% renewable energy by 2025. As part of this plan, the government has set a specific goal to enhance energy efficiency in Funafuti by 30%.
Disaster Risk Management
Disaster risk management in Tuvalu is a critical undertaking due to the country’s geographical location and exposure to various natural hazards. Tuvalu has established a Disaster Management Act (2007) to provide a legal framework for coordinating disaster response, preparedness, mitigation, and recovery efforts and has aligned its policy efforts with the Sendai Framework for Disaster Risk Reduction 2015-2030. The National Disaster Management Office (NDMO)/Department of Disaster Management (DDM) is responsible for managing and coordinating disaster risk reduction and emergency response activities. This includes implementing strategies to mitigate risks, enhancing preparedness measures, and facilitating prompt responses to disasters. Additionally, Tuvalu actively engages in regional and international partnerships, collaborating with international organizations such as the United Nations, the World Bank, and neighboring countries to bolster its disaster risk management capabilities.
Drinking Water Supply
Tuvalu heavily relies on rainfall and rainwater harvesting as the primary sources of drinking water supply. However, the country has been grappling with a shortage of potable water due to factors such as reduced rainfall and the contamination of groundwater caused by rising sea levels. The persistent droughts in Funafuti have further exacerbated the depletion of rainwater reserves, reaching a critical point where the government declared a state of emergency in November 2022. Similar to other Pacific Island Countries, Tuvalu confronts multiple challenges related to limited water resources, insufficient storage capacity, and inadequate sanitation infrastructure. In response to these issues, the government has implemented various water governance measures. These include initiatives for desalination to increase the availability of fresh water and more efficient management and conservation of the country’s scarce water resources. These efforts aim to address the immediate water shortage and build long-term resilience in the face of ongoing climate challenges.
Urban Roads & Transport
Funafuti faces unique challenges in terms of urban roads and transport due to its small size and geographical constraints. As a narrow coral atoll, Funafuti consists of a thin strip of land that spans approximately 2.8 square kilometers. The island’s limited land area and growing population pose challenges for urban road infrastructure and transportation. The road network in Funafuti is relatively small and mainly concentrated within the main town area. Notably, the main highway is the only fully paved road in Tuvalu, while other areas predominantly have unpaved roads, which can pose difficulties, especially during typhoon season. Public transportation options are also limited, primarily relying on shared taxis known as “teaka,” which operate on specific routes within the town to cater to residents and visitors. As the population continues to grow and urbanization progresses, there is an increasing need for improved urban road infrastructure and transportation services in Funafuti. To address these needs, the Tuvalu Priority Infrastructure Investment Plan 2020-2025 has identified priority investment projects aimed at enhancing road quality and constructing new roads throughout Tuvalu.
Solid Waste Management
Solid waste management is a pressing environmental challenge in Tuvalu, exacerbated by limited land resources, population growth, and urbanization. Although precise data on the quantity and composition of municipal solid waste is not readily available, it is estimated that only 80% of household waste is collected in Funafuti, with only paying households receiving weekly waste collection services from the local government, Funafuti Kaupule. Consequently, improper disposal methods like burning and illegal dumping are common, leading to significant environmental and health risks. To address these issues, the government has introduced the “Tuvalu Integrated Waste Policy and Action Plan 2017-2026,” serving as the primary national policy framework for waste management. This plan aims to strengthen institutional systems, fill gaps in waste management, and foster robust public-private partnerships in waste delivery.
Local Administration
Tuvalu, a sovereign nation, operates under a unitary system characterized by a democratic parliamentary structure. The governance of Tuvalu consists of two tiers: national and local. The legal framework governing local government in Tuvalu is established by the Falekaupule Act of 1997. At the local level, Tuvalu follows a single-tier system, wherein each of the eight main inhabited islands has a Kaupule (island council) or town council in Funafuti. The administration of the ninth island, Niulakita, falls under the jurisdiction of Niutao Kaupule. However, the authority of each island council is confined to its respective island. Each Kaupule is composed of six members who are elected for a maximum of two four-year terms. Additionally, every island has a traditional assembly of elders known as a Falekaupule. The Ministry of Home Affairs (MHA), which encompasses the Department of Rural Development responsible for local government affairs, oversees the administration of Tuvalu’s local government.
City Population, 2017; Clgf, 2022; Pacific Private Sector Development Initiative n.d.; The Economist, 2021. Land Administration: The World Bank, 2018. Housing: Adu et al, 2023. Energy: Sarpong, Gideon, 2023. Disaster Risk Management: NADMO; Mensah-Bonsu, 2022. Water: Urban Water Blueprint; Deutsche Bank. Roads and Transport: Kashi et al. Solid Waste Management: Mudu et al, 2021. Local Administration: CLGF.
Key Considerations for Investment Planning & Prioritization
Concluding Questions
What is the most surprising result for you in this City Scan?
What patterns did this City Scan illuminate that you had not considered before?
What are your city’s critical development challenges?
What other information would you like in order to corroborate or amplify the information in this City Scan?
Who else would you like to speak with to gain further understanding about your city’s development challenges?
What investments need to be prioritized? What trade-offs are inherent in your prioritization?
What investments could be coordinated? What benefits would such coordination bring?
Last edited 2025-05-15.
This City Scan is a product of the City Resilience Program.
The findings, interpretations, and conclusions expressed in this City Scan do not necessarily reflect the views of the World Bank, the Executive Directors of the World Bank, or the governments they represent. Given that the data included in this work are derived from global sources, the World Bank does not guarantee its accuracy.