Honiara, Solomon Islands
Honiara, Solomon Islands
City Scan
May 2025
![]()
![]()
![]()
![]()
Executive Summary
Setting the Context
Honiara is the capital city of the Solomon Islands, located on the island of Guadalcanal in the southwestern Pacific Ocean. Honiara is bordered by the Coral Sea in the north. This analysis includes the capital city of Honiara and surrounding areas.
Population and Demographic Trends
Honiara’s population has grown between 1986 and 2019 with an average growth rate of 4.5% annually, and in 2019 the area had a population of 130,176. A large portion of the population lives inland, away from the coast. Wealth, however, is more prevalent at the coast.
City Competitiveness and Economic Activity
Economic activity appears to be increasing the Point Cruz area of Honiara.
Built Form
Most of Honiara’s built-up area has remained constant since 1985. From 2001, built-up area has increased by 6.8%. Most of the land is tree cover, followed by grassland and built-up area. Schools are well distributed within the area. However, health facilities are few and not easily accessible for much of the population.
Climate Conditions
Solar energy is moderately available in Honiara. Air quality is good across the city, and the concentration of particulate matter is below WHO safety standards. Honiara appears to have a high prevalence of vegetation, especially in the south. In recent years, there has been significant deforestation in the east, and inland.
Risk Identification
Flooding is a moderate risk in Honiara, and risks of earthquakes and landslides are present and significant. Coastal flooding and sea level rise especially threaten eastern Honiara, between the city and the airport. The area is more exposed to surface water flooding than river flooding, with 17% of the built-up area exposed. Since 1990 there have been four large flood events. Cyclones regularly pass nearby. The populated area near Vavaea ridge has a moderate landslide susceptibility. The risk of earthquakes is high and damage is heavy.
Local Institutions and Planning
Honiara is governed by the Honiara City Council which is responsible for the administration and development of the city. The Solomon Island’s long-term economic development is guided by its National Development Strategy (2016-2035). The “Greater Honiara Urban Development Strategy”, developed by the Ministry of Lands, Housing and Survey, in partnership with the Asian Development Bank, serves as the development framework for the city.Setting the Context
Basic City Information
Honiara is the capital city of the Solomon Islands, located on the island of Guadalcanal in the southwestern Pacific Ocean. It serves as the political, economic, and cultural center of the country. Nestled at the confluence of the Matanikau River, which courses through its center,
Honiara is bordered by the Coral Sea to the north and the mountains of the island’s interior to the south. Honiara’s local economy is predominantly driven by the services sector, owing to its status as the administrative hub of the Solomon Islands. The city accommodates national government offices, foreign embassies, and diplomatic missions, generating employment opportunities for the local population. The economy also thrives through wholesale and retail trade, banking services, and the restaurant and hotel industries. Additionally, the informal sector plays a crucial role, especially in the marketing of food products and handicrafts, and serves as a vital connection between the country’s rural and urban economies.
Nonetheless, Honiara’s economy is highly susceptible to external factors, including fluctuations in commodity export prices, variations in tourism demand, and unforeseen events. Additionally, the city faces increased vulnerability to natural hazards, which are projected to intensify in the near future. Rising sea levels, increasing ocean temperatures, and acidification present ongoing challenges to the economic development of the Solomon Islands.
The boundary lines mark the area of interest for the City Scan. These lines may differ from the city’s official administrative boundaries and may include multiple jurisdictions.
Population and Demographic Trends
Population Density
- Population density is highest in the city of Honiara near the coast
- The Chinatown area in the Capital Territory has a high population density, along with the Point Cruz area
This map estimates population numbers per 10,000 m2 grid cell. It provides a more consistent representation of population distributions across different landscapes than administrative unit counts. Knowing where people are is critical for impact assessments and intervention plans, especially those focused on service delivery, food security, climate change, network systems and natural disasters.
Population Growth
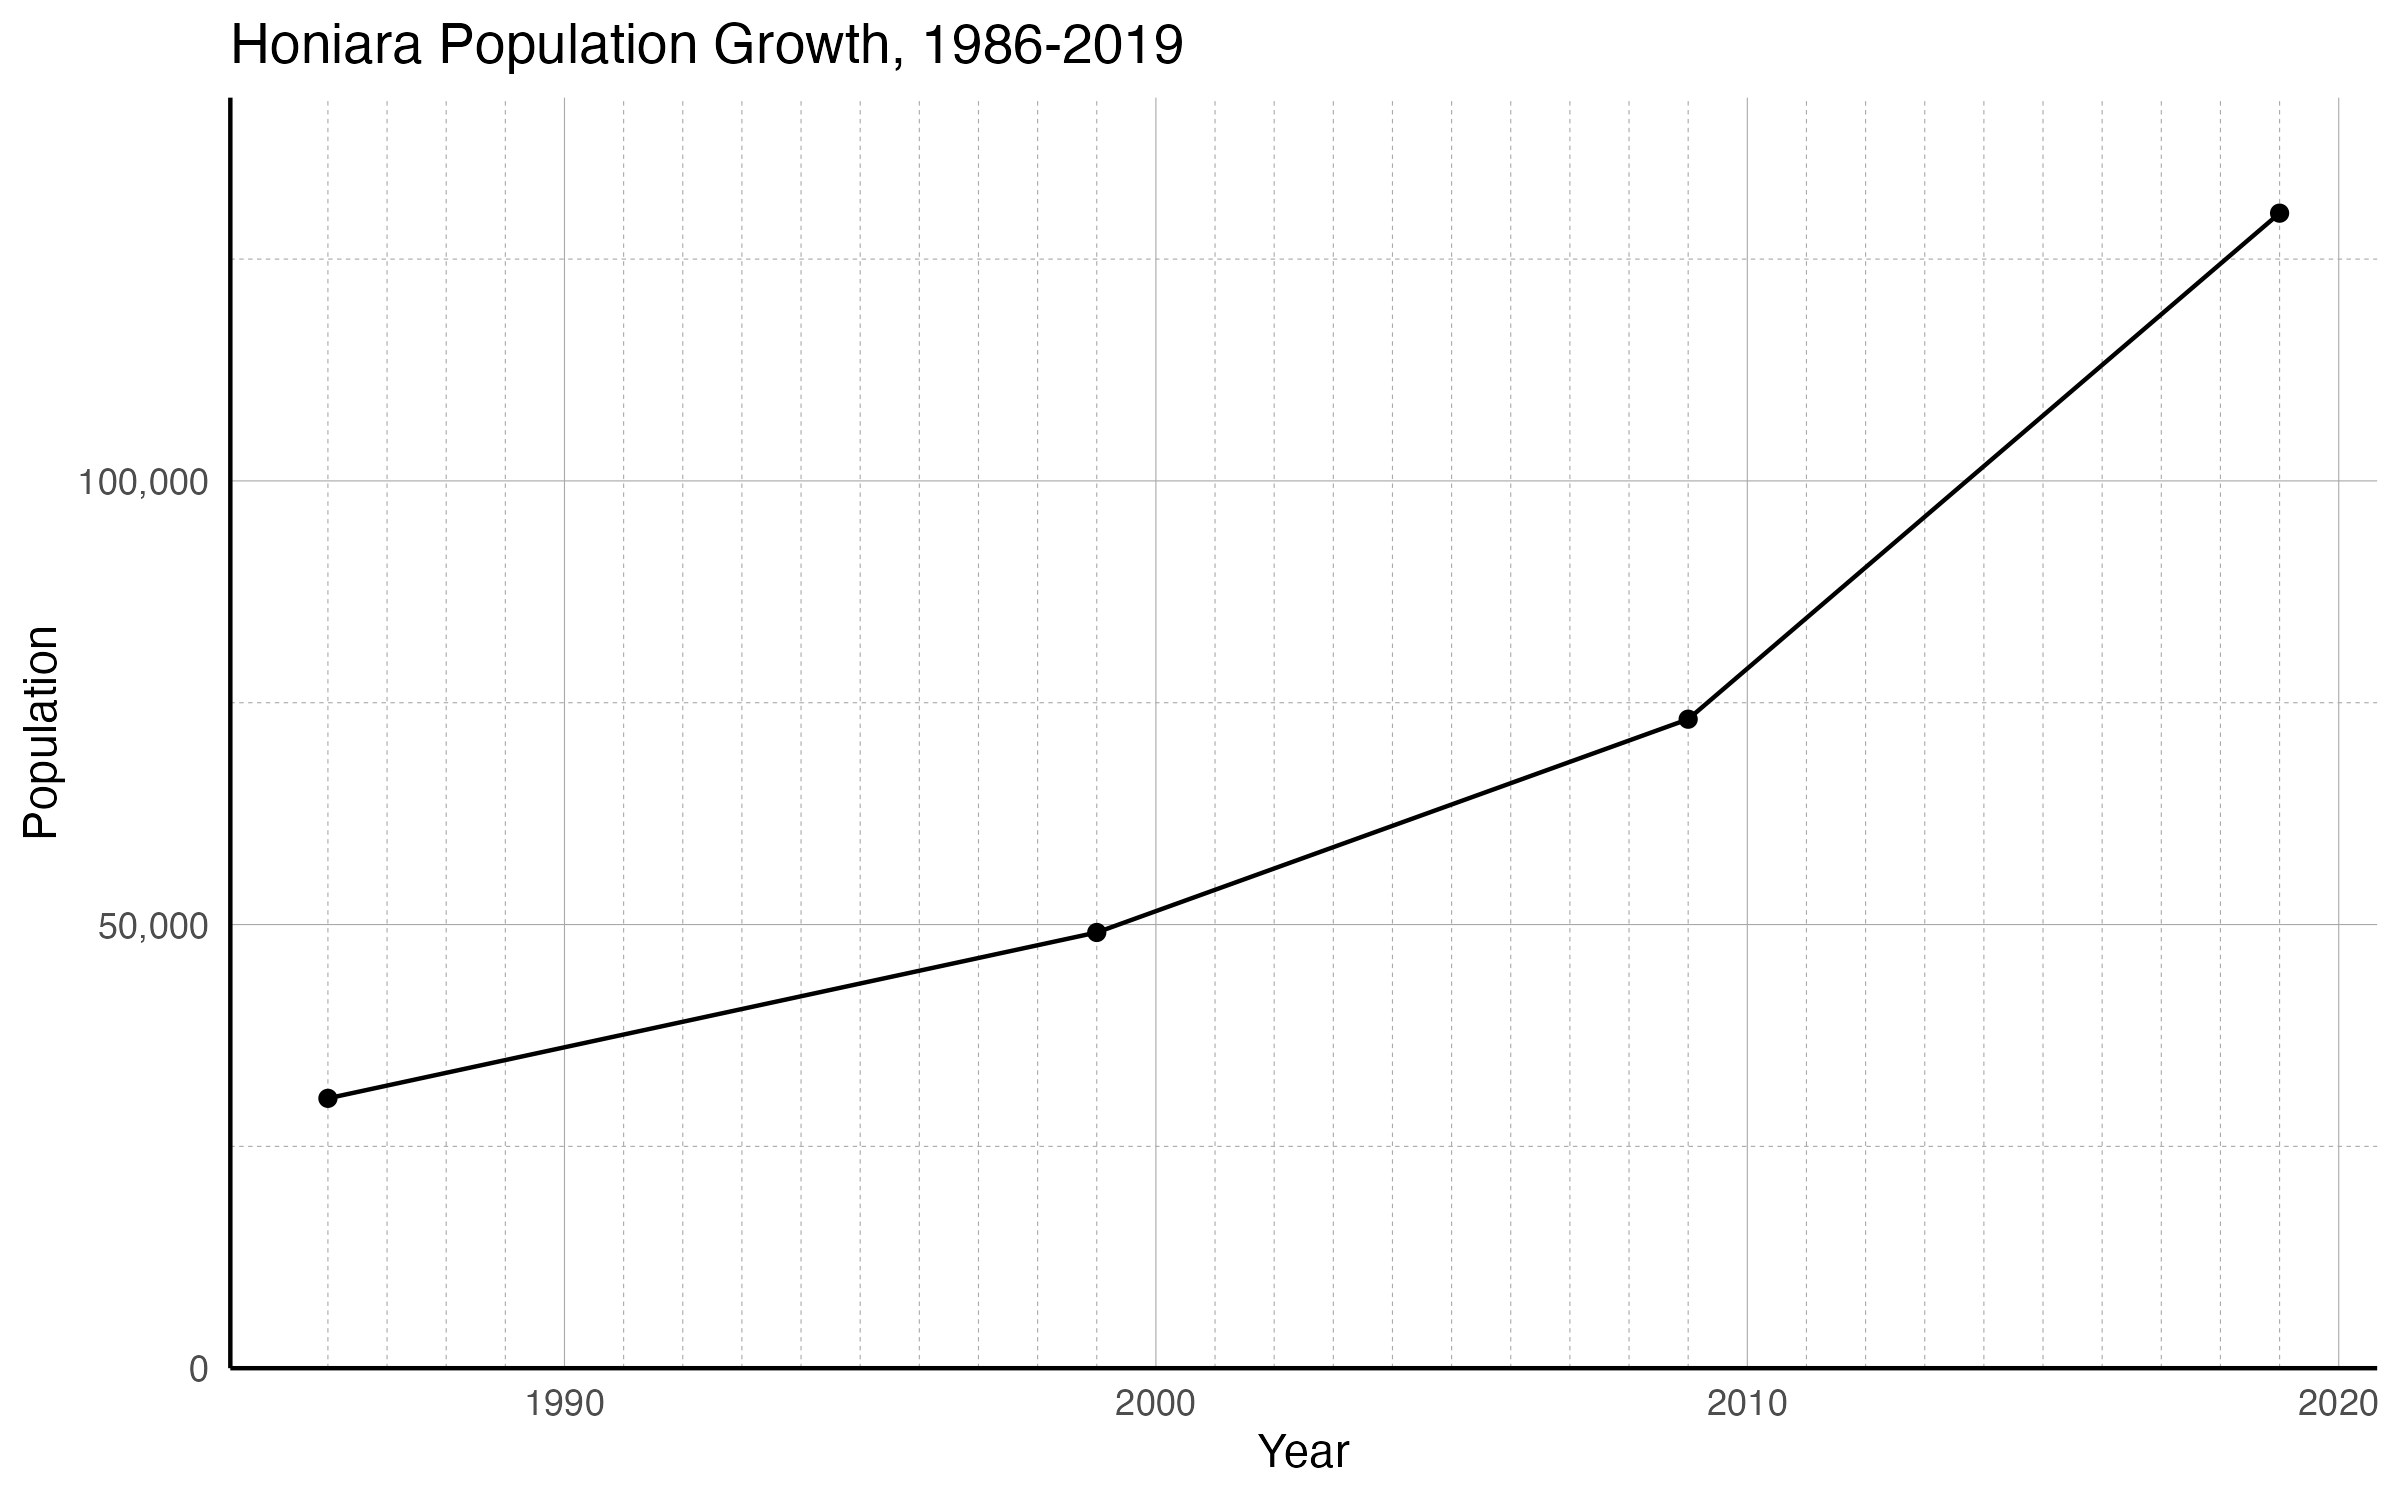
- Honiara’s population increased by 328% from 30,413 in 1986 to 130,176 in 2019, at an average annual rate of 4.5%
- Growth increased significantly after 2010.
Population figures are typically used as a denominator for many indicators, and are a measure of demand for services. The line chart above summarizes the city’s population change according to census and other public data. High growth of urban populations, caused by rates of natural increase (more births than deaths) in urban areas, migration from rural to urban areas, and the transformation of rural settlements into urban places, puts pressure on cities to meet the new demand.
Population Density
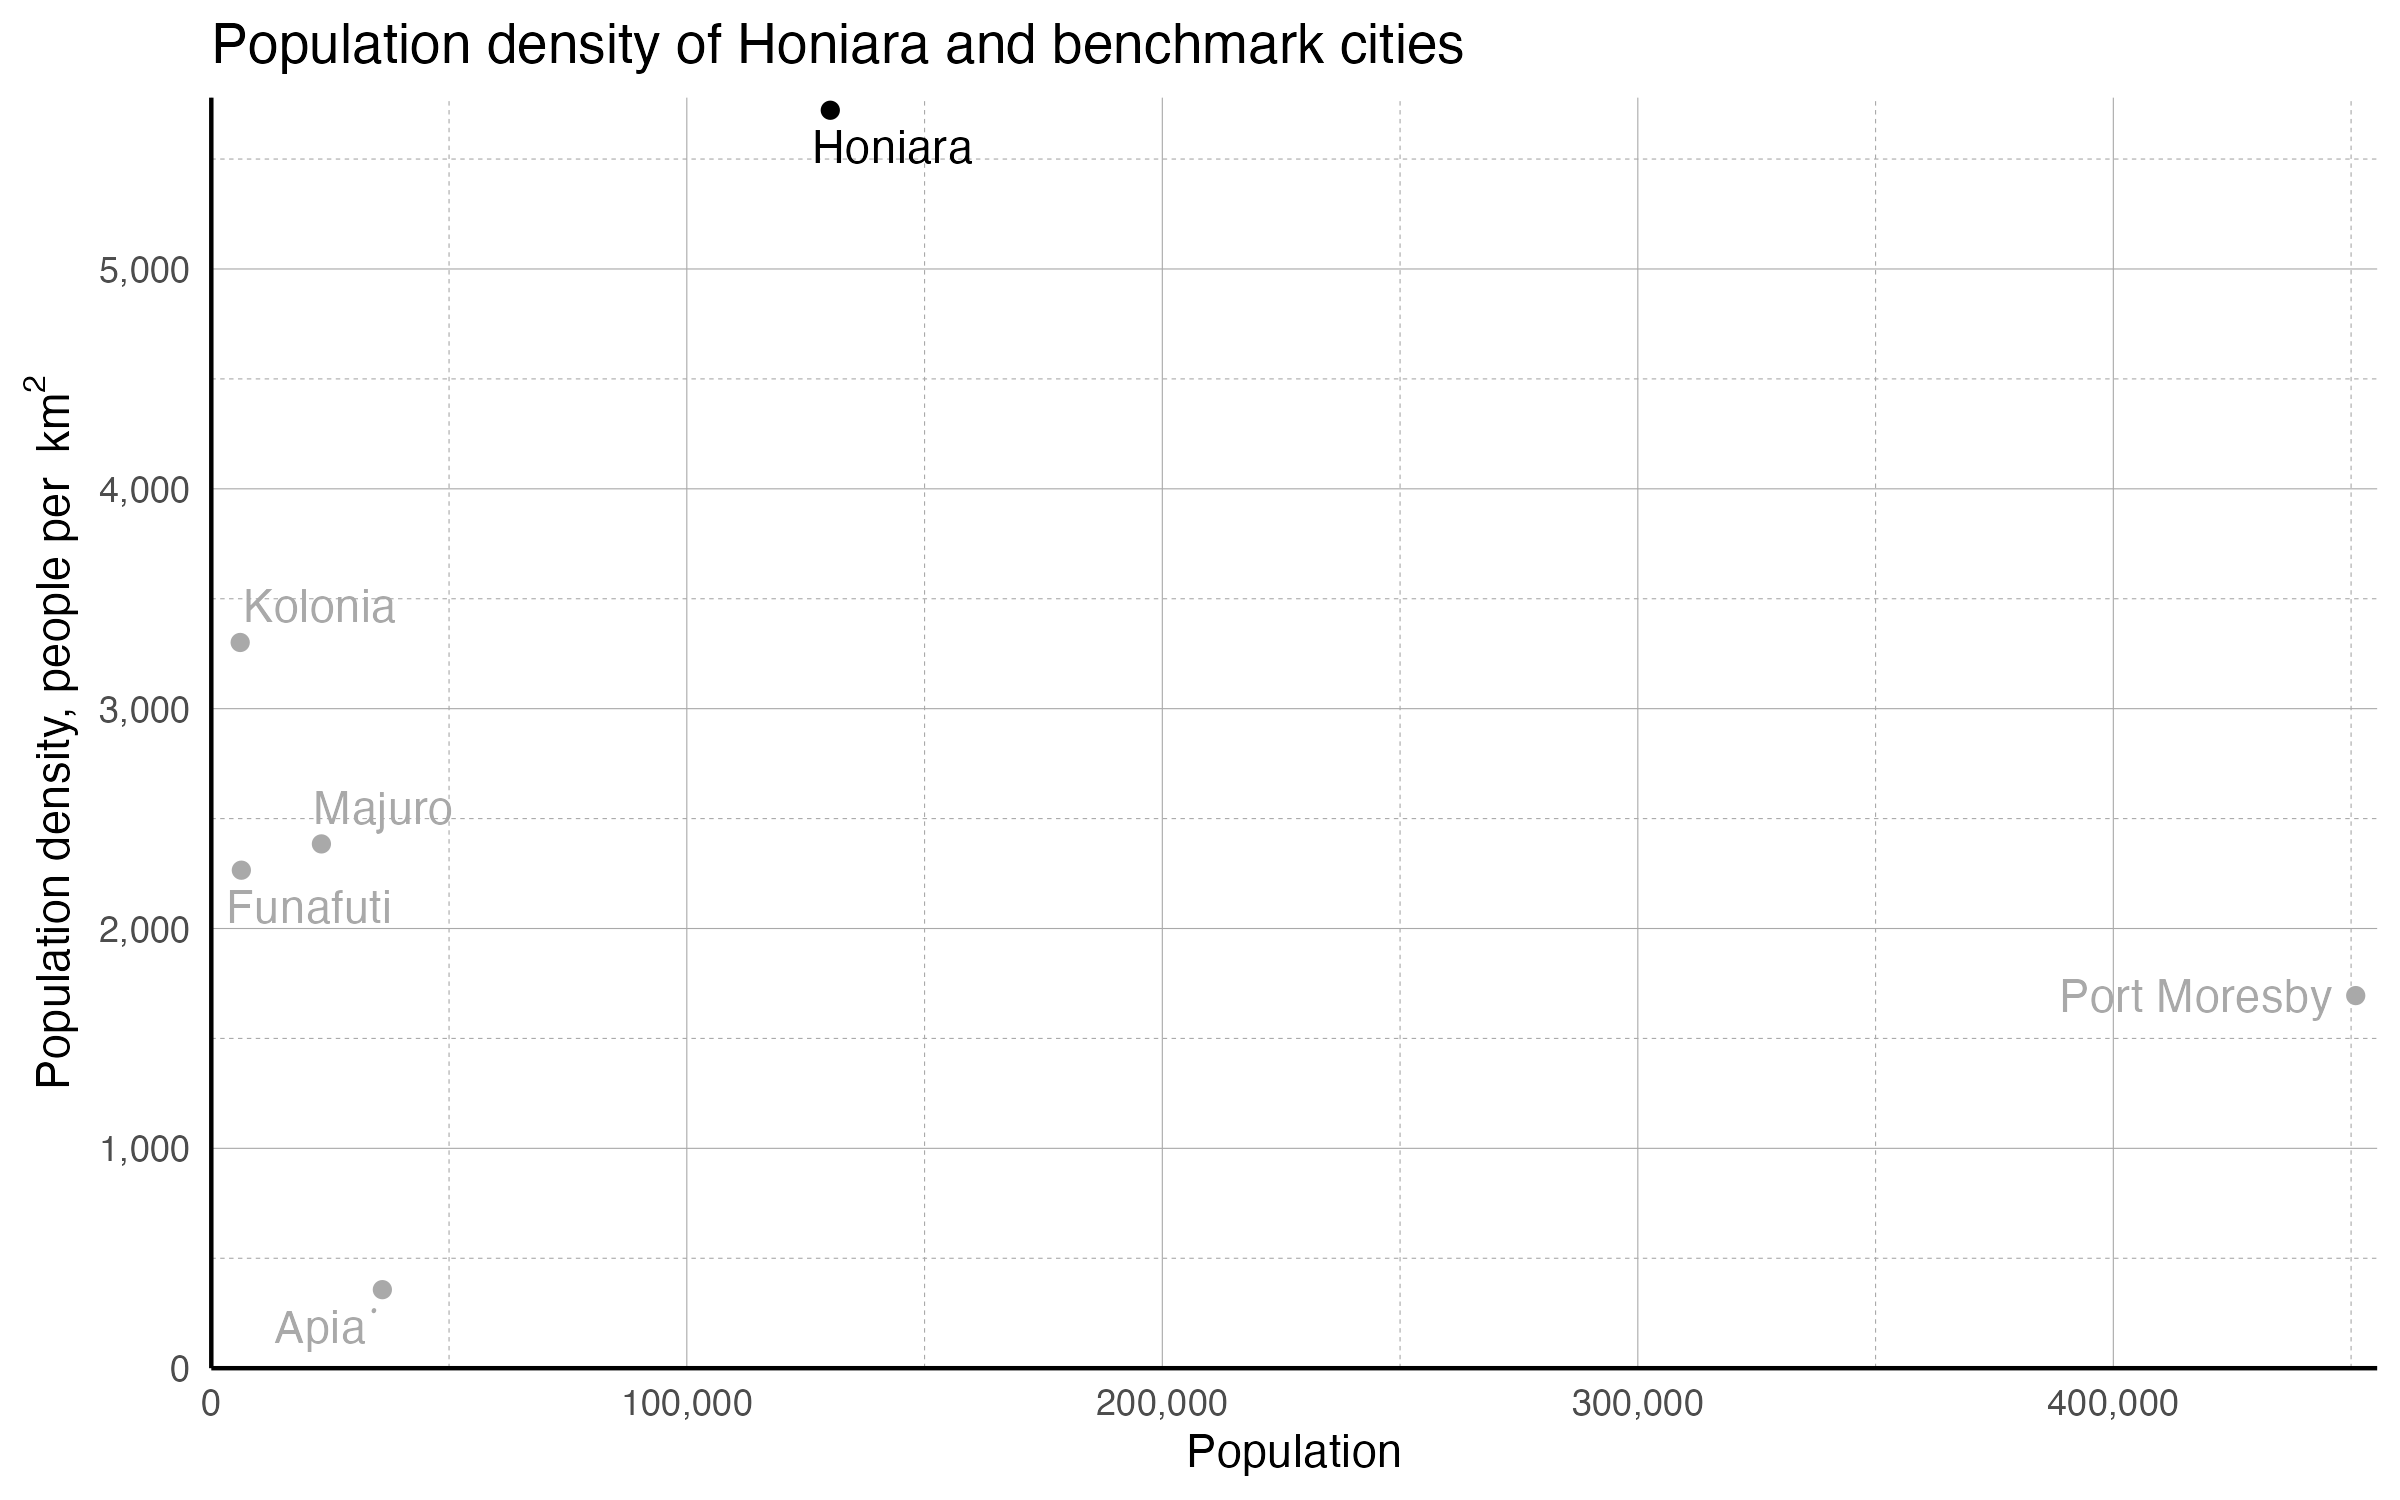
- With an area of 22.8 km2, Honiara has a population density of 5,722 people per km2
- Among the 5 regional benchmark cities, Honiara has the highest density
Density is calculated using the most recent census population recorded and the official land area occupied by the city, and is an important measure of how cities function. Higher population density enables governments to more easily deliver essential infrastructure and services in urban areas at relatively low cost per capita. However, such benefits do not materialize automatically or inevitably. Whether a city’s population dynamics pose challenges or offer opportunities typically depends on the policies in play.
Populations and area are from Oxford, 2022, “Oxford Economics” or CityPopulation.de. Note that Oxford Economics uses quite large extents for its cities, meaning that the measured density is likely considerably lower than the density experienced by most inhabitants of the cities. Extents used by the both data sources may differ from the AOIs used by the City Scans.
Population Distribution by Age & Sex
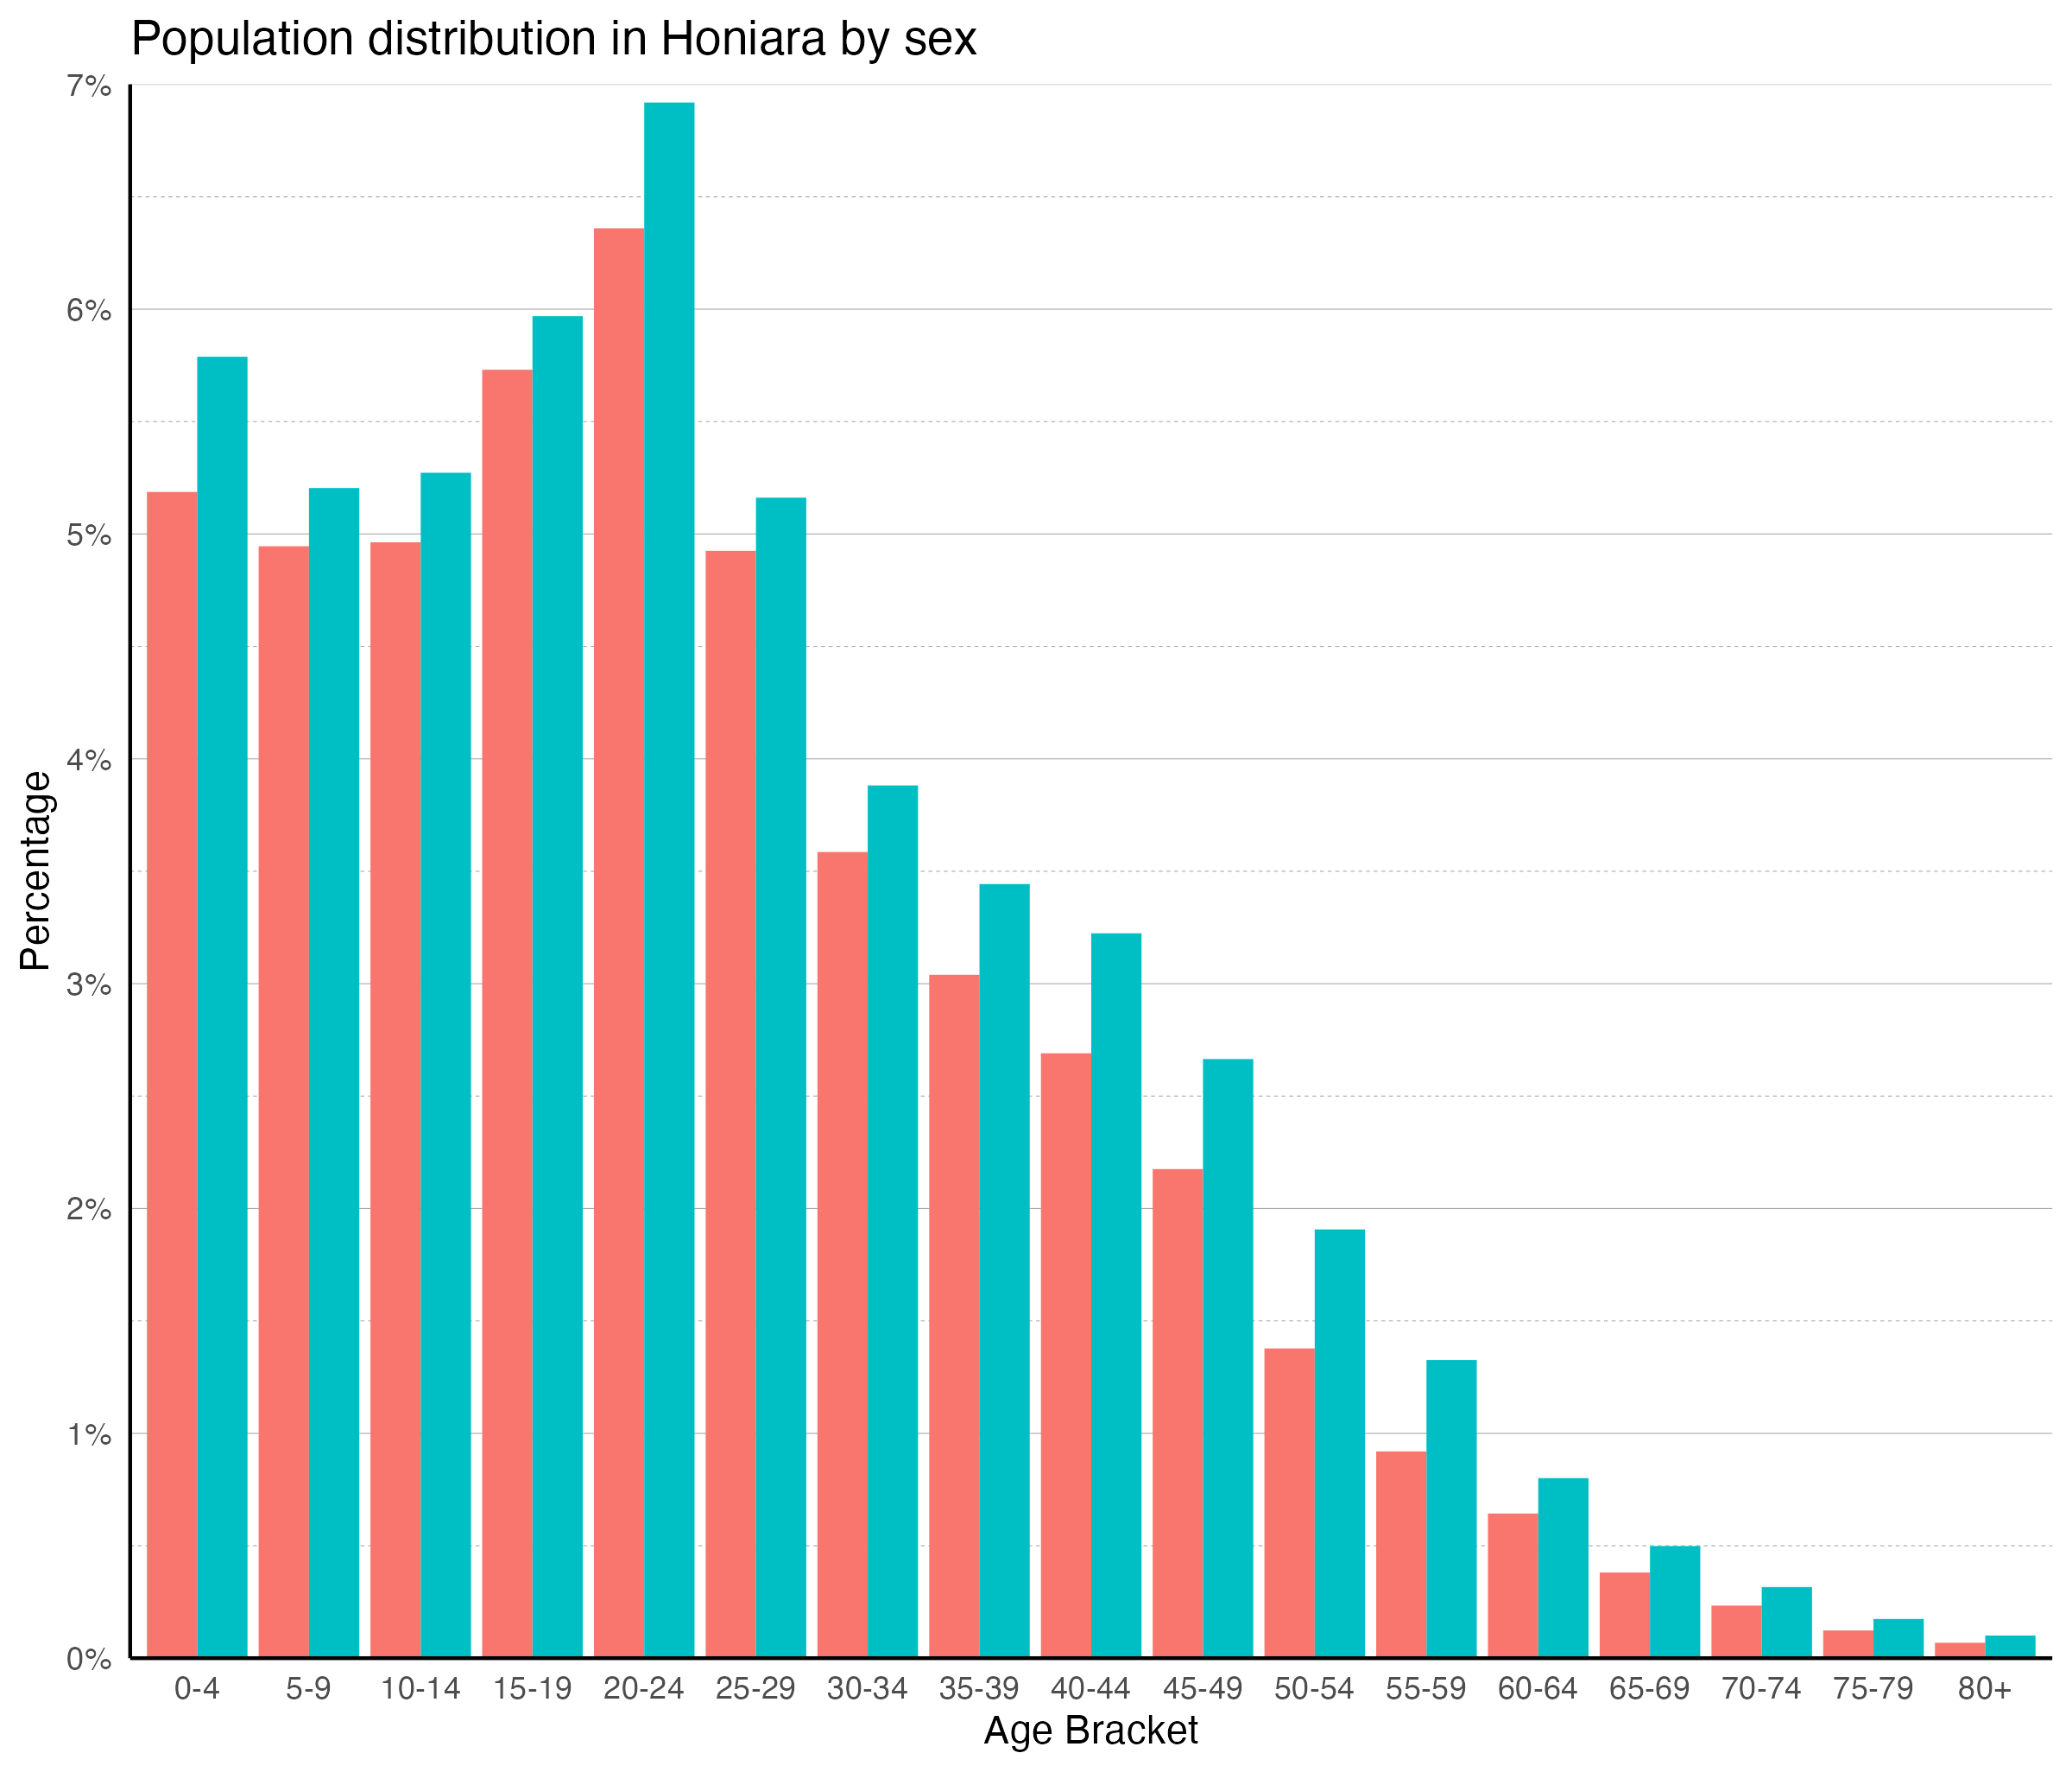
- The median male in Honiara is older than the median female
- The largest age groups for males and females are ages 20–24
- There are many more males than females in Honiara, with 111 males for every 100 females
- 60% of all women in Honiara are of reproductive age
- Of the total population, 11% are children under 5, 25% are youth (15–24), 67% are of working age (15–64) and 3% are elderly(60+)
This column chart classifies the city’s population according to age group, forming the basis of population projections. Populations vary significantly in their proportions of young and old people, with growing populations generally appearing younger, and declining or slowly growing populations generally appearing older.
Data from WorldPop. Bondarenko, et al, Estimates of total number of people per grid square broken down by gender and age groupings for 51 countries across sub-Saharan Africa in 2020 using Ecopia.AI and Maxar Technologies building footprints, 2020.
Reproductive age is defined as 15–49. Working age is defined as 15–64.
Economic Activity
Economic Hotspots
- There are two main nodes of economic activity in Honiara
- The largest sits in the Point Cruz area of Honiara, and the second lies near the Kukum Highway in the northeast
- The activity in Point Cruz is likely related to the port located there
This map measures the total emissions of nighttime lights from the monthly average of radiance for 2014 through 2022. Nighttime light radiance is a common proxy for economic activity: where there is more artificial light, there is generally more commercial activity. VIIRS observations are made fairly late at night, as its satellites cross the equator at around 1:30 local time; thus, the observed lights are typically street lights and nights which are left lit all night long. The correlation of nighttime light and economic activity is strongest for urban areas; it is less relevant in agricultural areas and areas with very low population density.
Map data from NOAA, “VIIRS Daily Mosaic”.
Change in Economic Hotspots
- Economic activity appears to be increasing significantly in Point Cruz, which houses the wharf
- Activity seems to be decreasing in the city’s other node, near the Kukum highway
- Activity, though, appears to be increasing just to the northeast of this area
- Almost everywhere else, activity appears to be fairly constant, if not very slightly increasing
The map illustrates monthly temporal changes from 2014 to 2022 in the emission of nighttime lights, indicating changes in economic activity. Positive values represent an increase in the intensity of nighttime light emission and, by proxy, economic activity, while negative values represent a decrease in the intensity of nighttime light emission, and economic activity.
Map data from NOAA, “VIIRS Daily Mosaic”.
Built Form
Urban Extent and Change
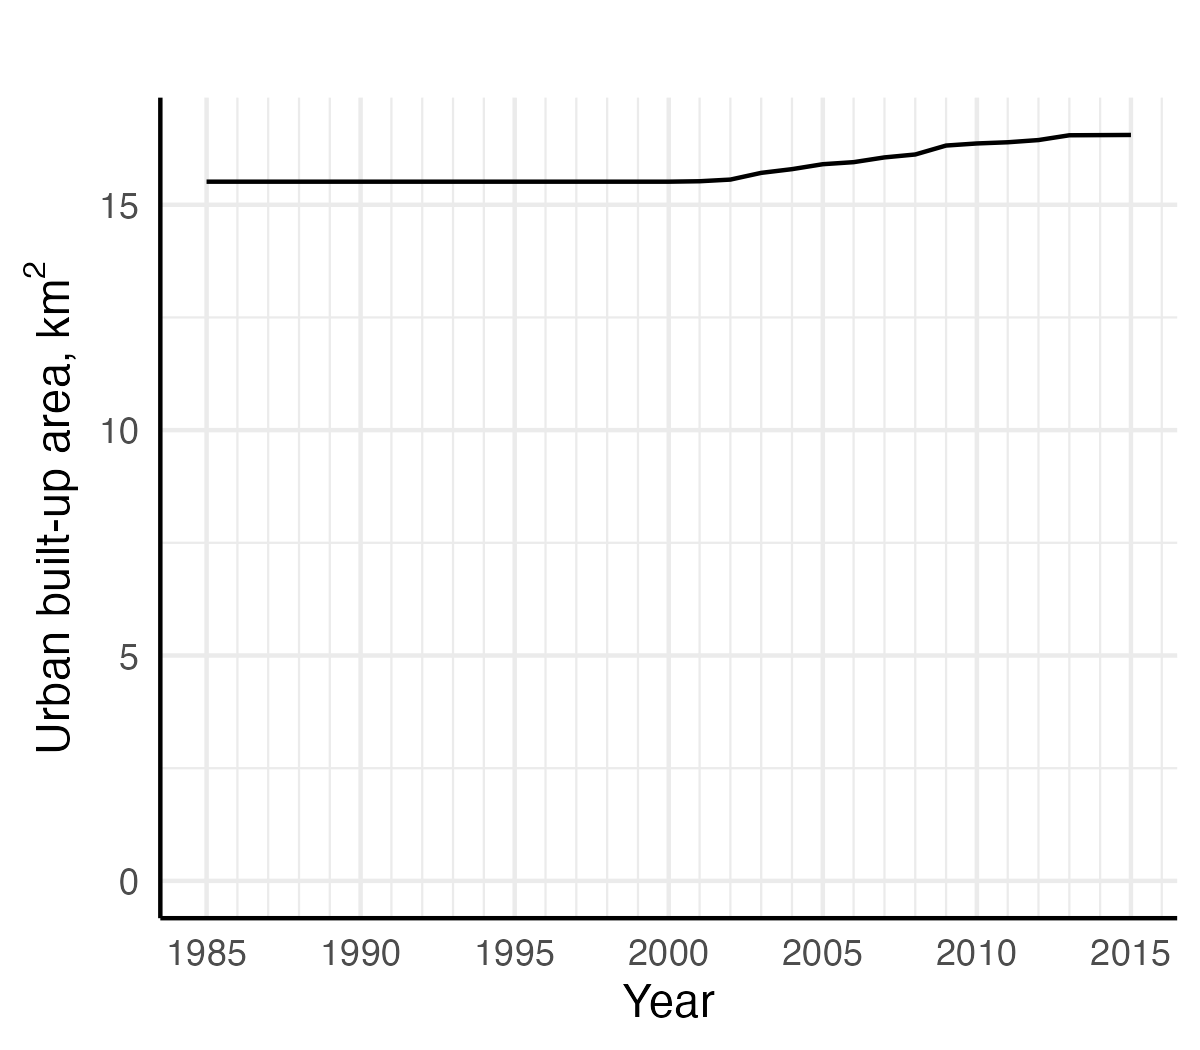
- The city’s built-up area grew from 15.51 km2 in 1985 to 16.55 km2 in 2015 for 6.7% growth
- Most of the present built-up area has existed prior to 1985
- Since 1985, Honiara’s built-up area has grown eastward towards the airport and inland to the south
Map data from DLR, 2015, “World Settlement Footprint Evolution - Landsat 5/7 - Global”.
Land Cover
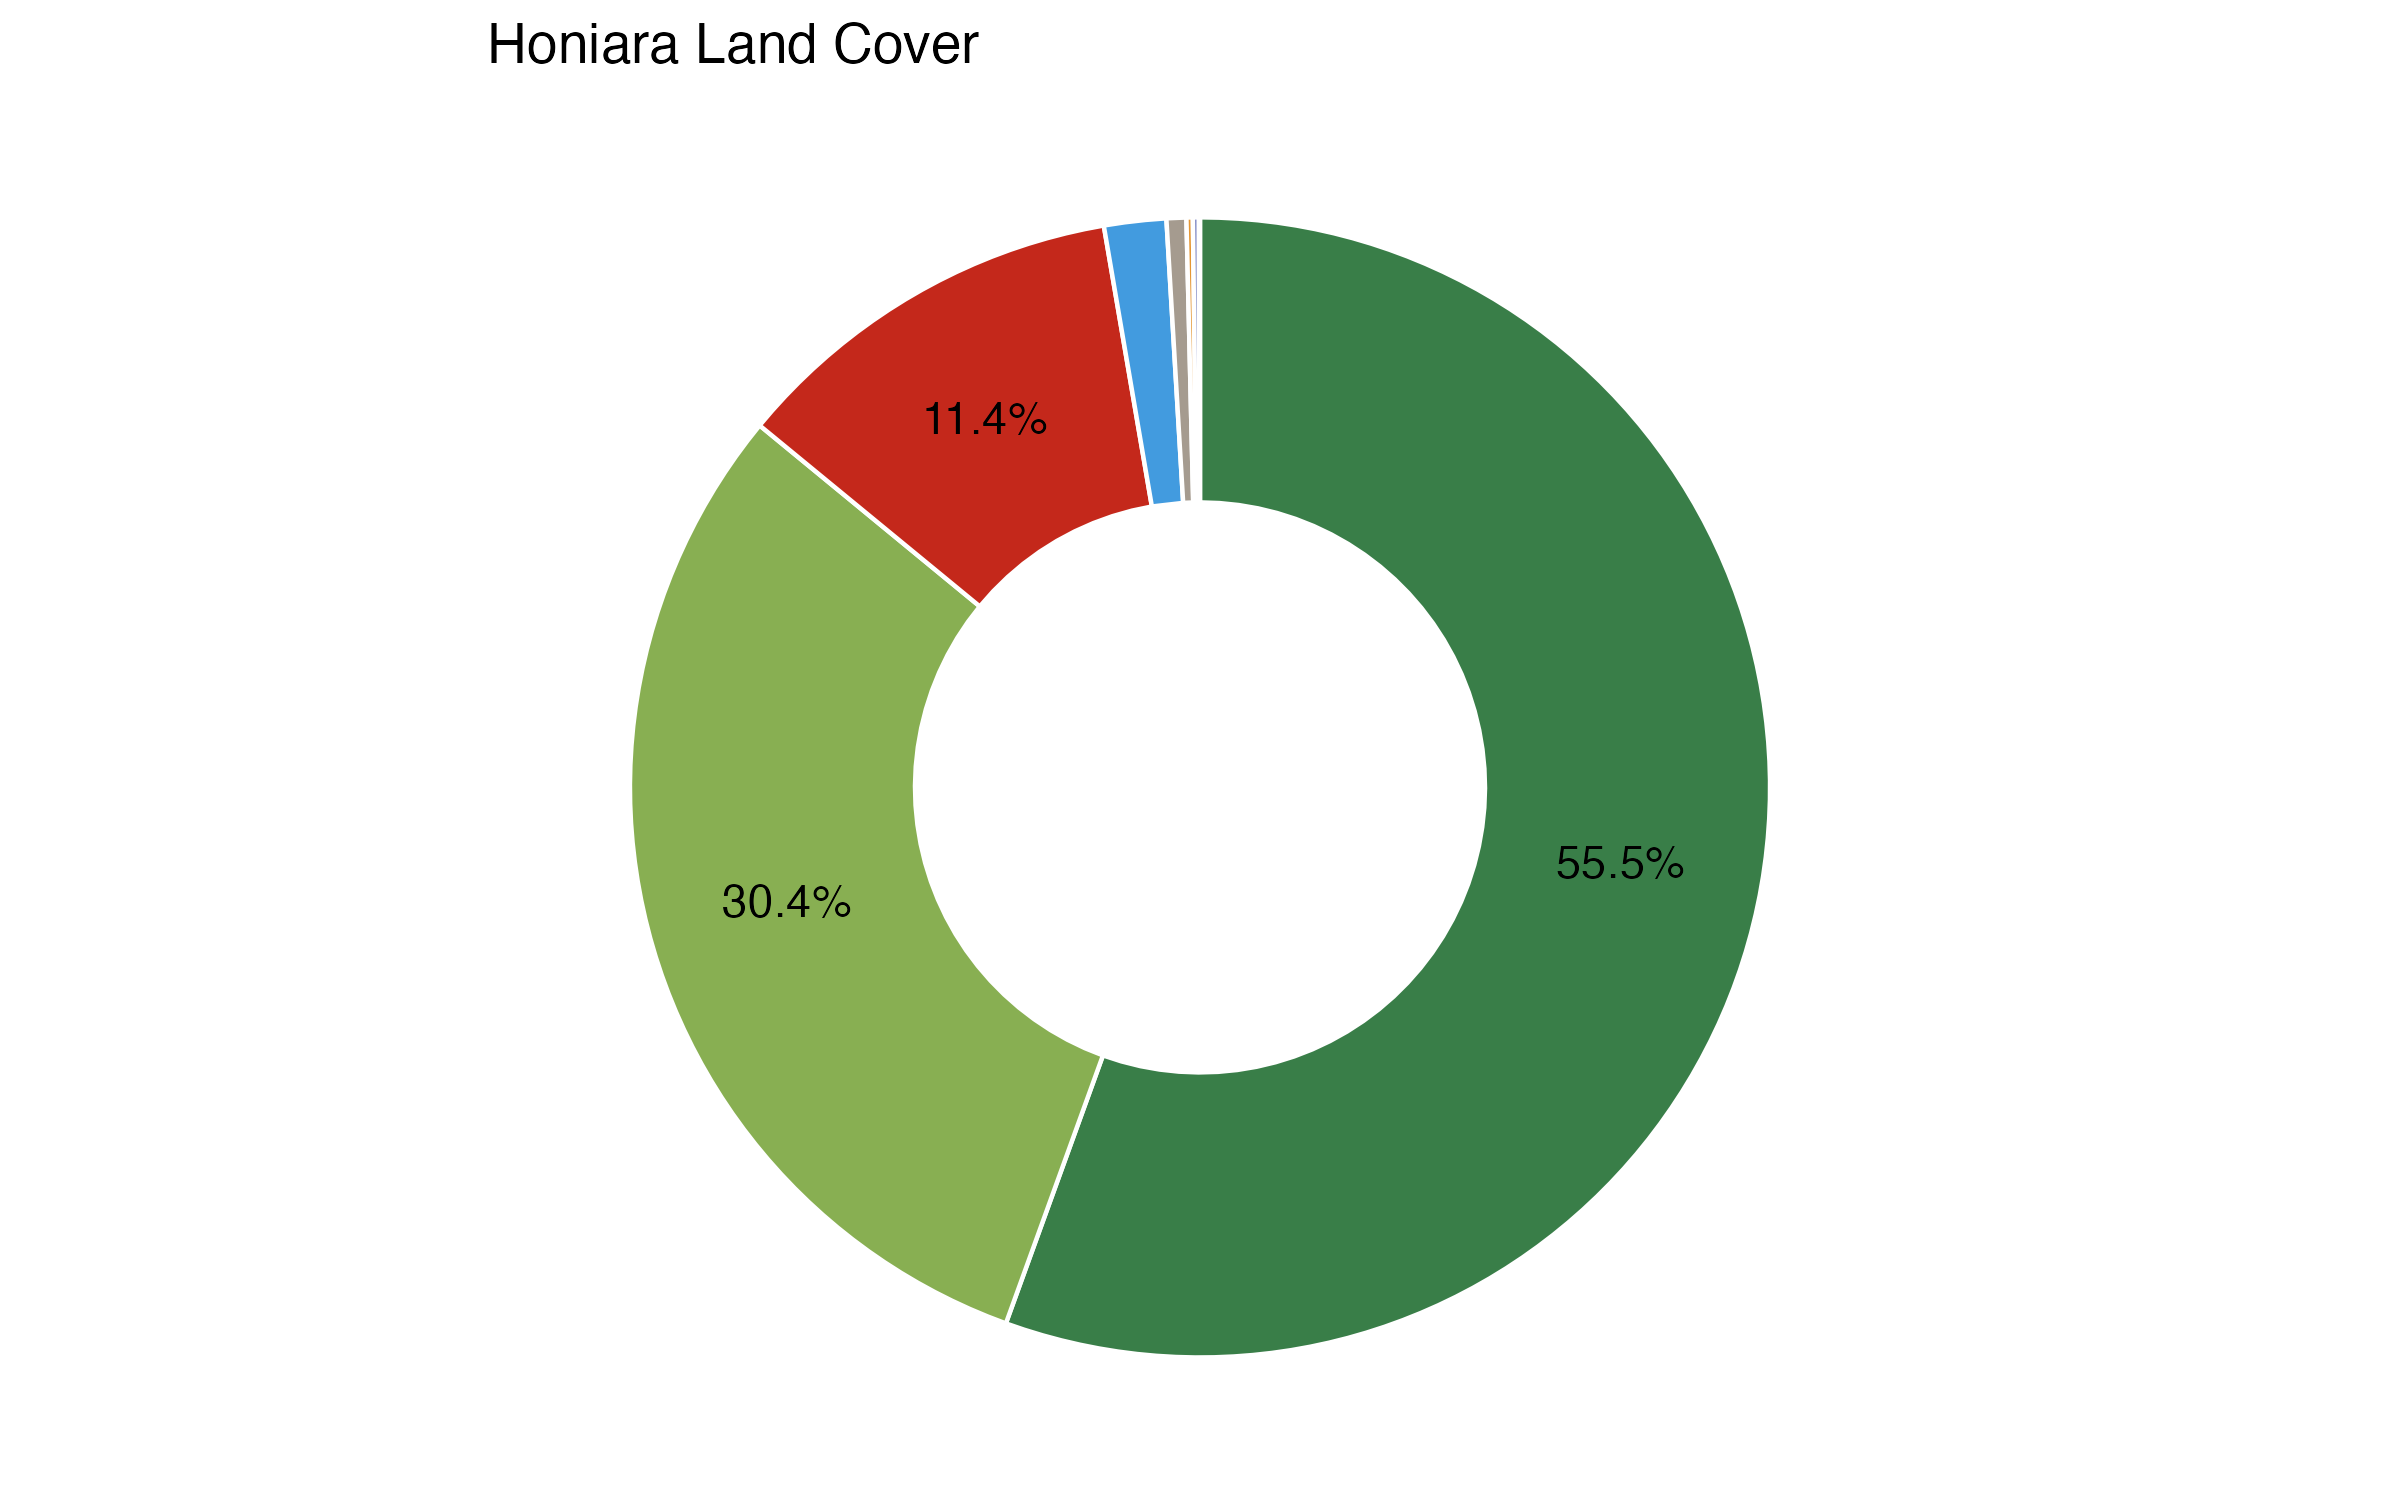
- Tree cover is the largest land class and covers 55.5% of all land
- Grassland is the next largest class, and comprises 30.4% of the total land
- Built-up area (11%) is toward the north of the city, along the coast
Land cover refers to the ground surface cover, including vegetation, urban infrastructure, water, and bare soil, among other classifications. Identifying land cover type helps to understand land utilization and inform planning policies and programs.
© ESA WorldCover project 2020 / Contains modified Copernicus Sentinel data (2020) processed by ESA WorldCover consortium’
Climate Conditions
Solar Photovoltaic Potential
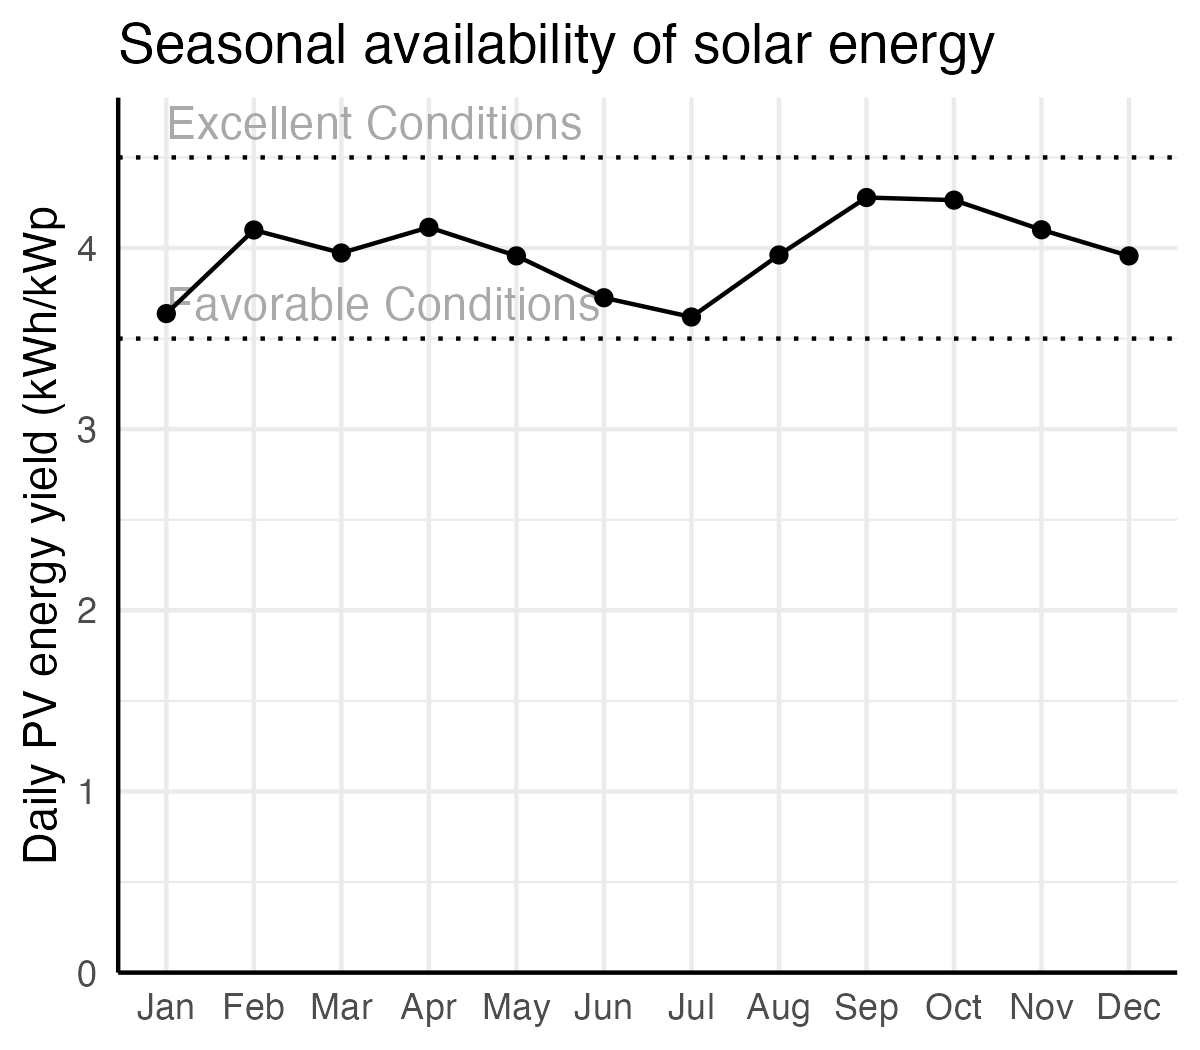
- PV power potential in Honiara is moderate (1,277–1,641 kWh/kWp annually)
- Seasonal availability is favorable for the entire year, and the seasonality is low, meaning solar energy can be relied on in all months
- This map does not reflect installed capacity or existing infrastructure required for the capture of solar energy
Solar electricity offers a unique opportunity to achieve long-term energy sustainability goals. Photovoltaics (PV) is the most widely applied and versatile technology for solar power. The availability of solar energy depends on site conditions. This map displays an indicative estimate of daily specific yield, that is, how much energy a hypothetical PV system would produce for per unit of capacity (kWh/kWp). Values above 4.5 are considered excellent availability, while values between 3.5 and 4.5 are moderate.
Map data obtained from the “Global Solar Atlas 2.0, a free, web-based application is developed and operated by the company Solargis s.r.o. on behalf of the World Bank Group, utilizing Solargis data, with funding provided by the Energy Sector Management Assistance Program (ESMAP). For additional information: https://globalsolaratlas.info
The Global Solar Atlas uses generalized theoretical settings for a quick assessment of PV power potential for a selected site. An optimum tilt angle of PV modules and 100% availability (no shutdowns due to failure) are assumed.
Air Quality
- Air quality is good across all of Honiara
- The concentration of PM2.5 in Honiara is between 2.5 - 5 μg/m3 across the whole city
- Air quality in Honiara appears to be lower than the WHO safety standards of 5 μg/m3 of PM2.5
- The uniformity in air quality across the city may be due to the map resolution or due to the dissipation of air from low density to high density areas
The concentration of particulate matter (PM) is a key indicator of air quality since it is the most common air pollutant affecting short and long-term health. This map displays the average annual concentration (µg per m3) of ground-level fine particulate matter of 2.5 micrometers or smaller (PM2.5).
PM2.5 particles are of greater concern than PM10 particles because their small size allows them to travel deeper into the cardiopulmonary system. According to the WHO and the United States EPA standards, PM2.5 concentrations should not exceed between 5 µg/m3 or 12 µg/m3, respectively. Higher concentrations of particulate matter may also reduce the availability of solar energy.
PM2.5 Grids are derived using annual data from 1998-2019 represent near-surface concentrations.
Map data from Hammer, 2022, “Global Annual PM2.5 Grids”.
Vegetated Areas
- Honiara’s vegetation increases from the northern coast to the inland hills
- There appears to be at least some vegetation everywhere except right along the shore
- As is expected, vegetation is less dense where population is greater, in the west; it is denser in the west, in the east near the airport, and along the area’s southern boundary
This map displays the Normalized Difference Vegetation Index, which ranges between -1 and 1, with higher numbers indicating a higher density of green vegetation. Values of less than 0.1 typically indicate water, rock, and otherwise barren land; values of 0.1 to 0.3 are associated with shrubs and grassland; 0.3 to 0.5 corresponds to moderate vegetation; and values of more than 0.5 correspond to dense vegetation such as forests or mature crops.
Vegetation and green spaces in cities are associated with health benefits and the mitigation of environmental risks. More green space in a city can reduce temperatures and the urban heat island effect, lessen air pollution, and absorb floodwaters. Green spaces can also serve important civic, social, and quality of life functions.
Map data from European Space Agency, 2020, “Normalized Difference Vegetation Index”.
NDVI-based measures do not account for the proximity and spatial arrangement of green spaces within areal units. They also do not address the vertical dimension and density of green urban buildup.
Forests & Deforestation
- The forested area is evenly distributed throughout the city, even in the populated areas
- In recent years there has been somewhat significant deforestation in the east, as well as in the inland to the south
Loss of forest areas and wetlands in urban catchments contributes to a reduction in green land cover. As soils are then more likely to be saturated with water, more precipitation runs off, increasing the risk of flash flooding. Halting the loss and degradation of natural systems and promoting their restoration can therefore be critical.
Map data from Hansen/UMD/Google/USGS/NASA, at 1 arcsecond resolution. Trees are defined as vegetation taller than 5 meters.
Risk Identification
Elevation
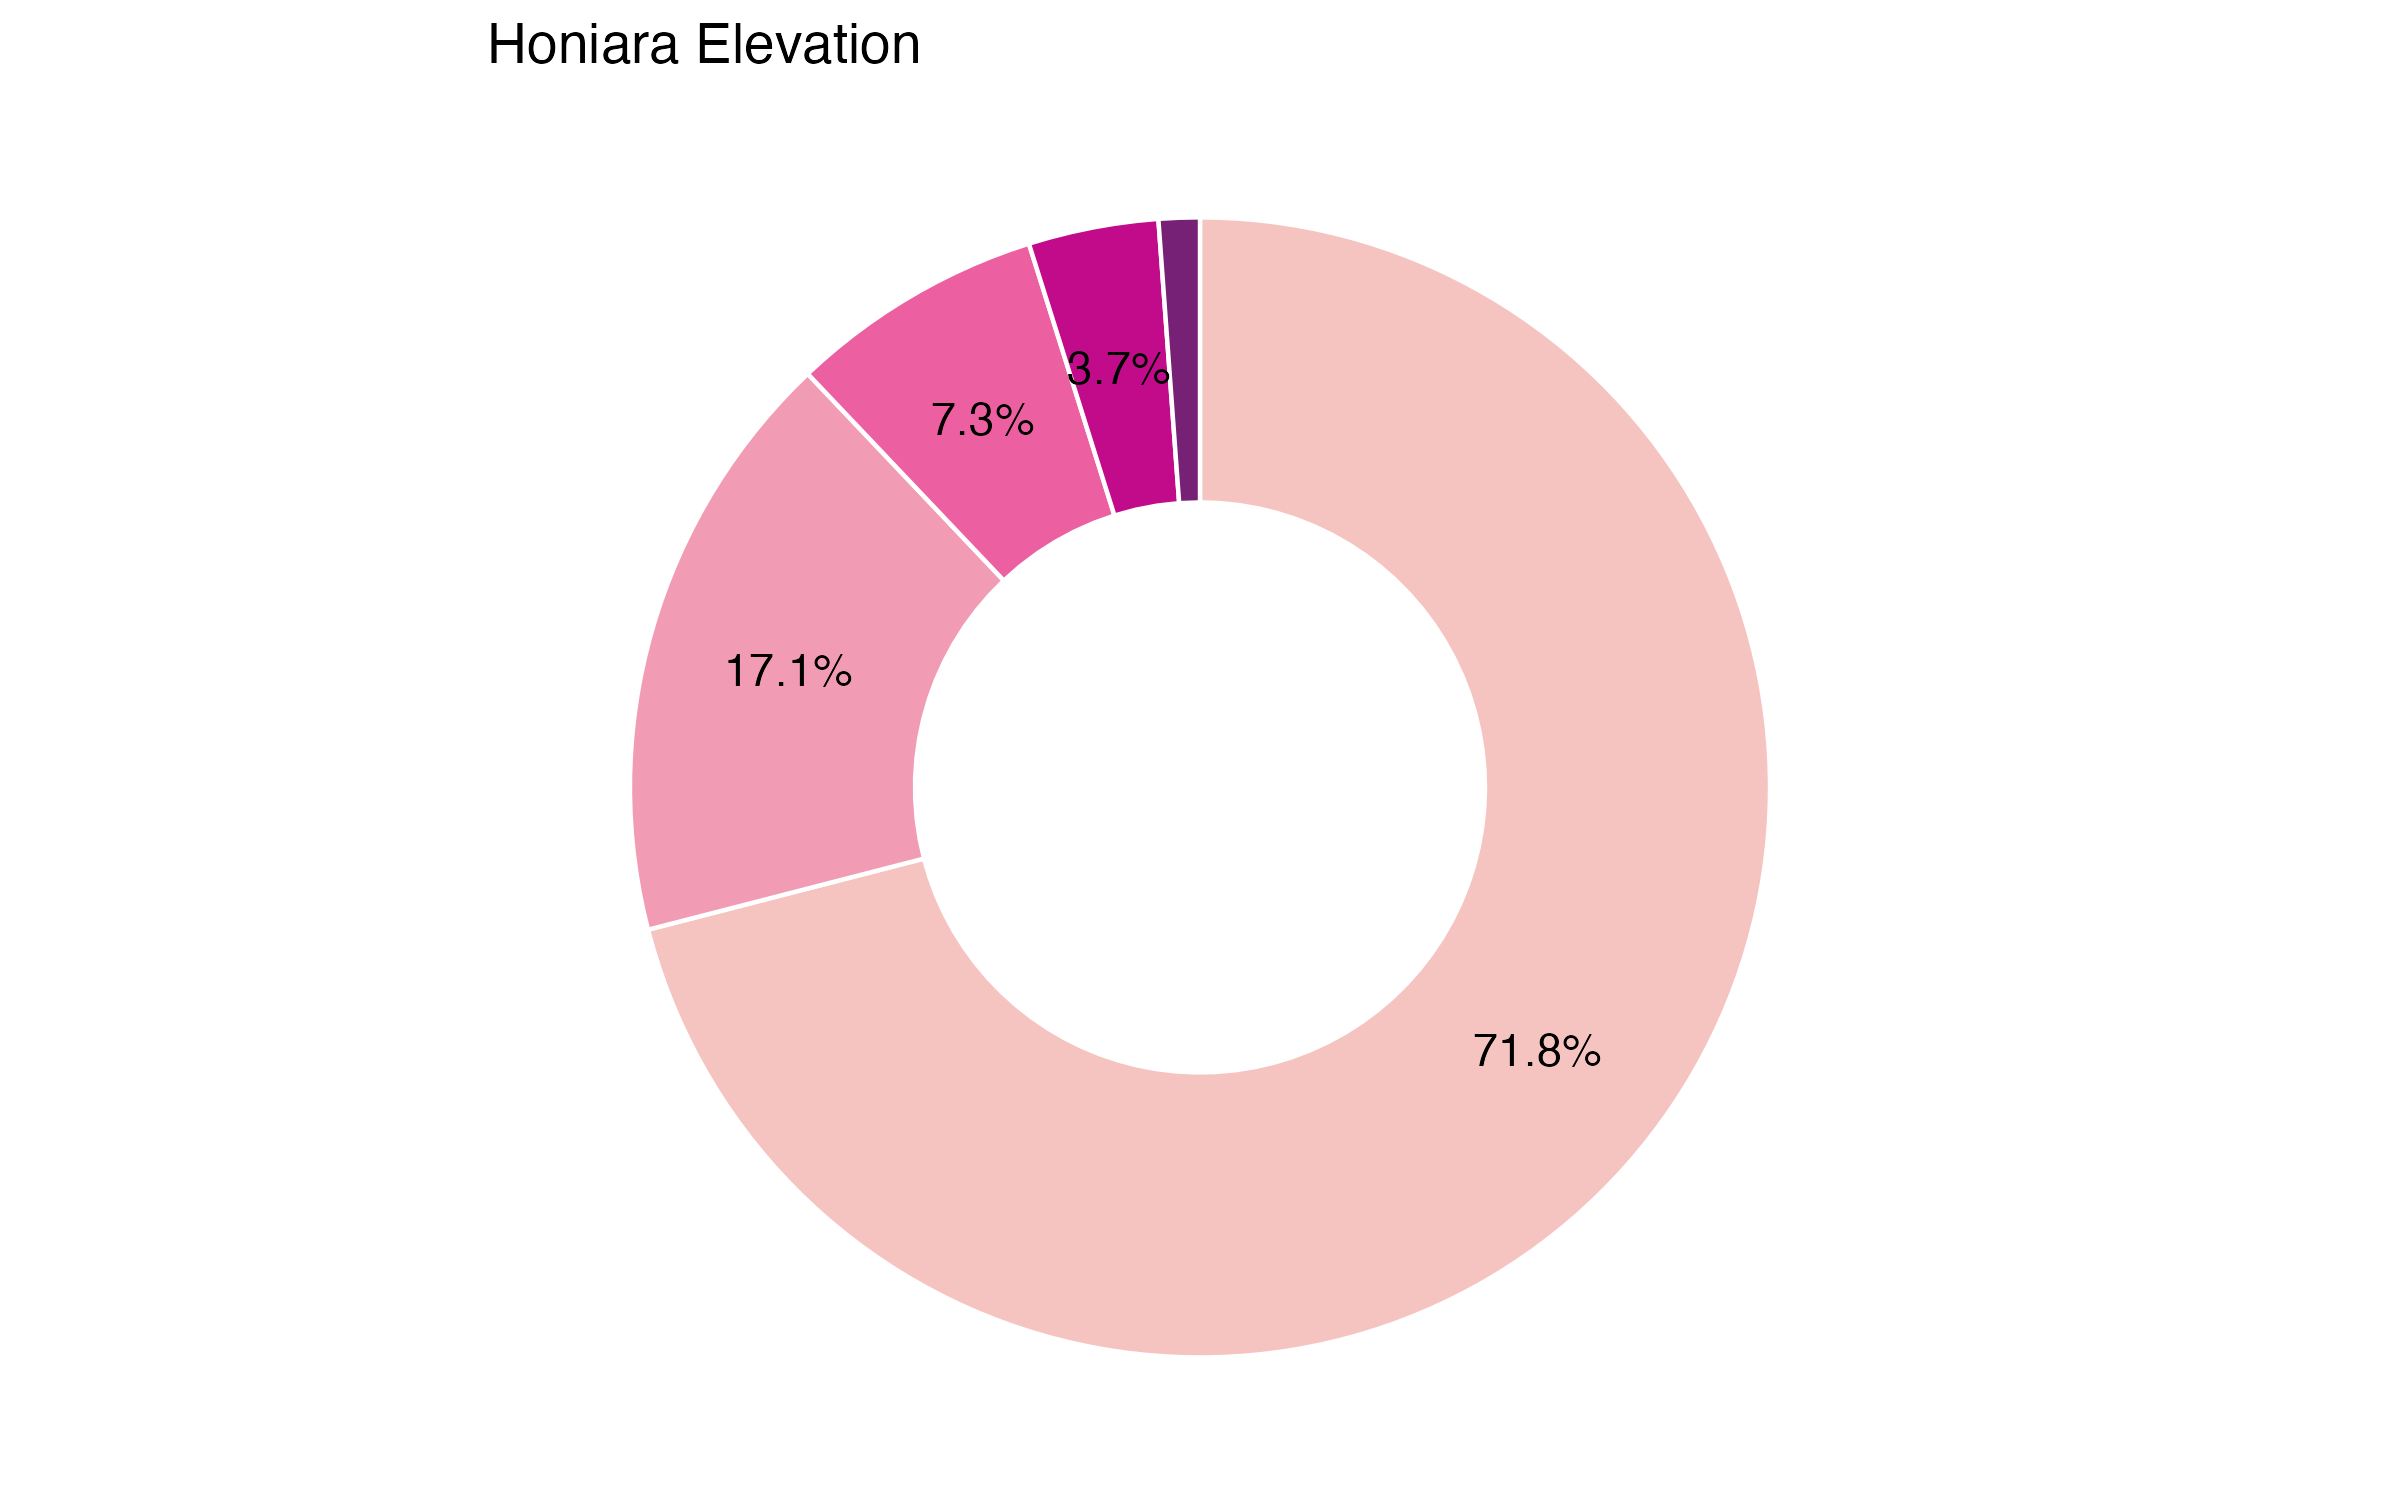
- The lowest area is the jut of the Lungga River Delta, to the west of the airport
- Everywhere west of the river on the jut, and most everywhere to the east, is less than 5 meters above sea level
- 20% of the area is less than 5 meters above sea level
Elevation informs an area’s vulnerability to many natural disasters. The height at which infrastructure, resources, and communities sit relative to normal water levels and tides, flood waters, and storm surges and waves informs their exposure. Elevation information is critical for communities to anticipate the impacts of disasters and to prepare resilient and cost-effective response and redevelopment strategies.
Map data from FABDEM V1-2.
Slope
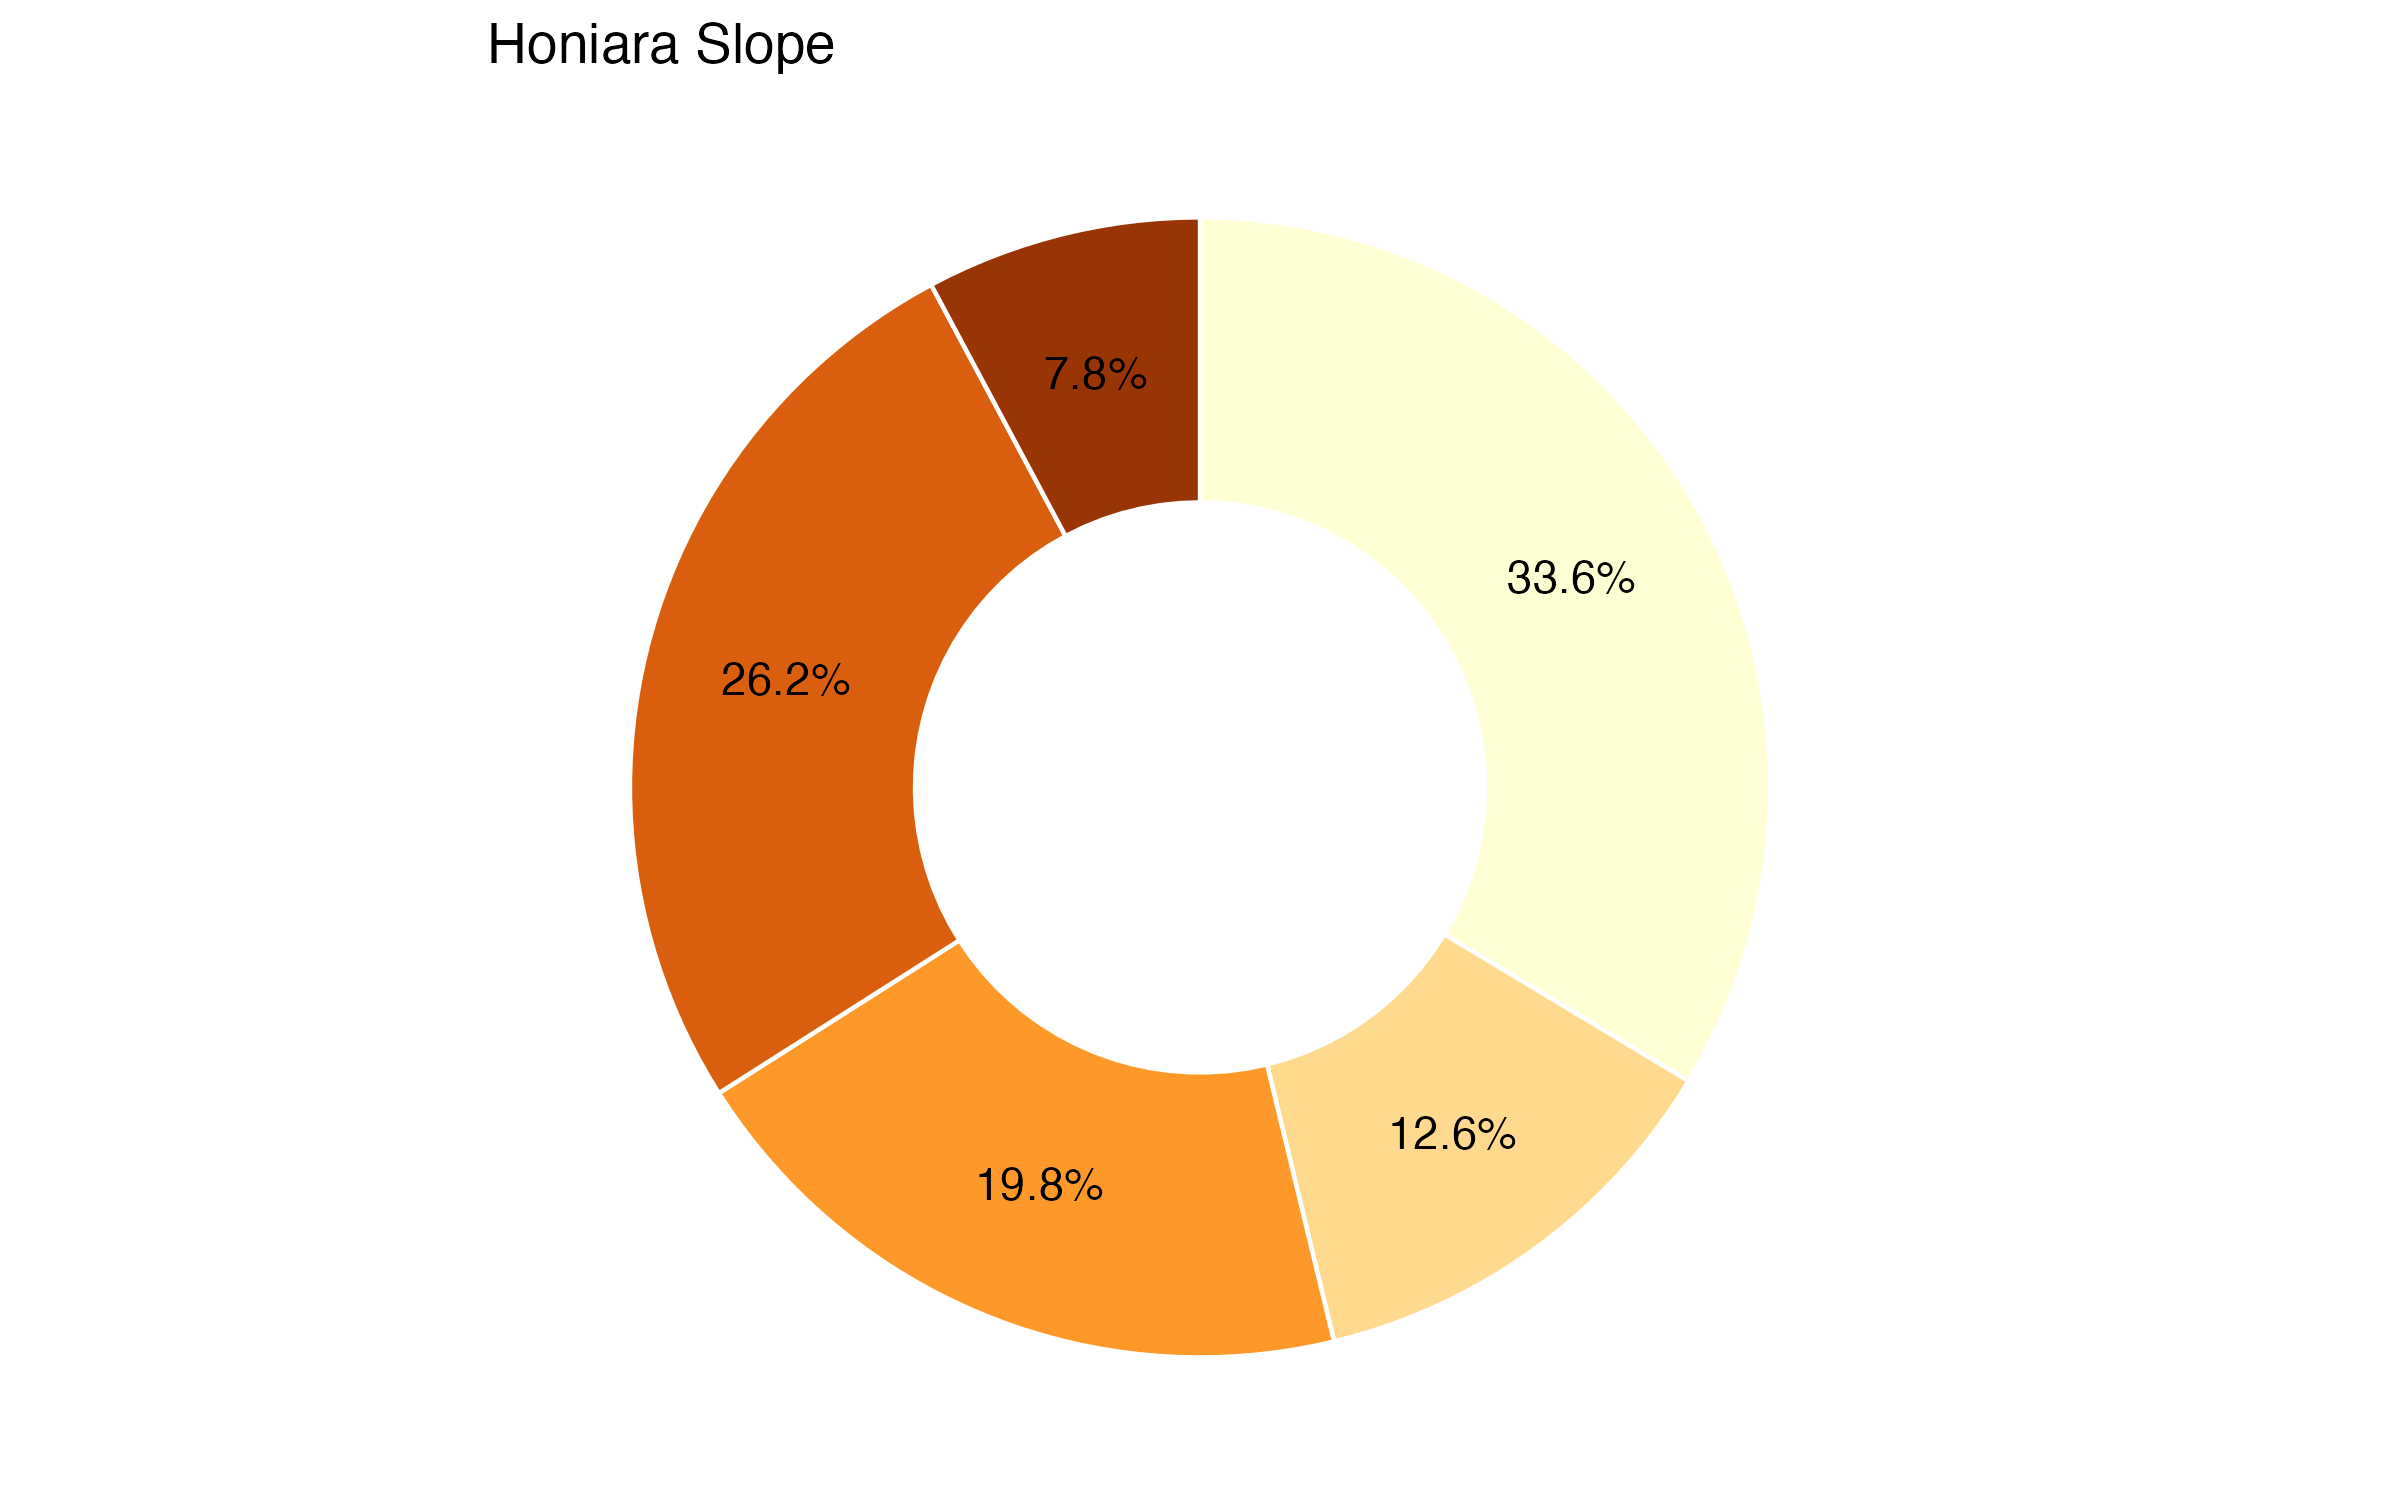
- The eastern part of the region is fairly flat with a grade of less than 2° (3.5% grade)
- In the southwest, and particularly populated regions, the land slope ranges from 5° to more than 25° in some areas (57.8% of land)
Slope refers to the percentage change in elevation over a certain distance. In hilly or mountainous areas, floods can occur within minutes after heavy rains, while in flat areas, floodwaters can remain for days. Considering the slope of land is important in reducing construction costs, extending services and public facilities, minimizing the risks of hazards like flooding and landslides, and mitigating the impacts of development on natural resources.
Map data from USGS, 2015, “USGS EROS Archive - Digital Elevation”.
Landslides
- Landslide susceptibility ranges between low and medium in the populated areas.
- Susceptibility is higher in the west of the city
This indicator refers to the likelihood that a landslide will occur in a particular area based on local terrain conditions. It shows the degree to which a terrain can be affected by slope movements, i.e., an estimate of “where” landslides are likely to occur. Susceptibility does not, however, consider the temporal probability of failure (i.e., when or how frequently landslides occur), nor the magnitude of the expected landslide (i.e., how large or destructive the failure will be).
This map combines satellite observations of rainfall with an assessment of the underlying susceptibility of the terrain. Steep slopes are the most important factor in a landscape’s susceptibility to landslides. Others include deforestation, presence of roads, strength of the bedrock and soils, and location of fault lines.
Map data from NASA, “Landslide Susceptibility Map”.
Liquefaction
- Honiara’s susceptibility to liquefaction ranges from moderate in the west to very high in the east
While all of the city has the same likelihood of seismic activity, areas within a city will typically have differing levels of vulnerability, due to factors such as soil and building construction. Liquefaction is a phenomenon where loosely packed or waterlogged sediments, particularly beneath buildings and under structures, lose their strength in response to strong ground shaking. Liquefaction in the event of an earthquake can cause increased damages.
This map calculates the likelihood of liquefaction using a combination of indicators such as peak ground velocity, precipitation and others. Each level determines a threshold of confidence regarding the probability of liquefaction in the particular pixel area.
Map data from Zorn & Koks, 2019.
Local Institutions & Planning
Administrative Structure
- Honiara is governed by the Honiara City Council (HCC) which is responsible for the overall administration and development of the city;
- The Mayor is the executive head of the HCC, who is indirectly elected by its councilors;
- The primary responsibilities of the Mayor and councilors include making by-laws within their legal authority and ensuring the delivery of services to the urban population;
- The Minister for Home Affairs administers both the Local Government Act (LGA) and the Honiara City Act (HCA);
- The HCA grants the minister various powers to oversee the council, including approving certain borrowing, lending, and investment activities;
- Members of the Honiara City Council are elected for a four-year term using the first-past-the-post system.
Availability Of Development Plans And Policies
- The Solomon Island’s long-term economic development is guided by its National Development Strategy (2016-2035);
- The country has established a legal and institutional framework for urban planning (The Planning and Development Act 2004), which includes national, provincial and local level plans;
- The “Greater Honiara Urban Development Strategy”, developed by the Ministry of Lands, Housing and Survey, in partnership with the Asian Development Bank, serves as the development framework for the city;
- The Honiara City Council assumes administrative and planning responsibilities; however, it does not possess the authority to allocate state land for development purposes;
- Despite these efforts, spatial planning in the Solomon Islands faces key challenges including corruption, complex land administration, and limited institutional capacity.
The State of Urban Infrastructure and Service Delivery
Land Administration
The land administration system in the Solomon Islands is a complex framework that encompasses various laws, institutions, and processes involved in the management, registration, and allocation of land throughout the country. The system is primarily governed by the Land and Titles Act, which provides the legal framework for land administration.The Ministry of Lands, Housing and Surveying is responsible for surveying and mapping land parcels, land registration and maintains the Land Registry, whereas The Commissioner of Lands oversees the allocation of state land, which can be leased or granted for various purposes including agricultural and residential development, or commercial activities. The country recognizes customary land ownership, where the majority of land is held under customary tenure by indigenous communities. As a result, any expansion of Honiara’s physical boundaries requires negotiations with customary landowners. There is a need for improved coordination between customary and statutory land management systems to strengthen effective land governance in the country.
Housing
The housing sector in Honiara faces several challenges, primarily driven by the high demand for affordable housing and a lack of suitable housing options. Honiara’s fast-paced urbanization has fueled the demand for affordable housing, where many low- and middle-income residents live. However, the scarcity of available land has led to the proliferation of informal settlements on the city’s outskirts, many of which lack essential infrastructure, services, and legal recognition. UN-Habitat estimates that 35–40% of the city’s inhabitants live in informal settlements. Moreover, many of these homes are built on marginal lands or hazardous areas, making them vulnerable to natural disasters and environmental risks. The Resilient Honiara Project, initiated by UN-Habitat in 2017, aims to implement a comprehensive city-wide settlements upgrading strategy in Honiara. This project is projected to benefit 750 households, positively impacting the lives of approximately 6,000 individuals residing in the city.
Energy
The energy sector in the Solomon Islands has undergone significant developments in recent years as the country aims to reduce its dependence on fossil fuels and transition towards renewable energy sources. The sector plays a crucial role in meeting the country’s energy needs, promoting sustainable development, and mitigating the impacts of climate change. Historically, the Solomon Islands heavily depended on imported fossil fuels for electricity generation. However, the government, in collaboration with international support, is actively working to diversify the energy mix and increase the proportion of renewable energy. In 2022, the government introduced the Solomon Islands Renewable Energy Roadmap, aiming to reform the management of the electricity sector and harness the country’s indigenous renewable energy resources. A key objective of the roadmap is to convert the Honiara electricity grid to rely entirely on renewable energy by 2030. In addition to shifting towards renewable sources, strengthening governance, policy-making, and coordination among key stakeholders in the energy sector are vital to creating a conducive environment for investment in green energy.
Disaster Risk Management
Disaster risk management in the Solomon Islands is a critical undertaking due to the country’s geographical location and exposure to various natural hazards. The country has established a Disaster Management Act to provide a legal framework for coordinating disaster response, preparedness, mitigation, and recovery efforts. Additionally, in 2018, the country developed the National Disaster Risk Management Plan to further enhance its ability to address and mitigate potential risks and hazards The Solomon Islands Ministry of Environment, Climate Change, Disaster Management, and Meteorology (MECDM), is responsible for managing and coordinating disaster risk reduction and emergency response activities. This includes implementing strategies to mitigate risks, enhancing preparedness measures, and facilitating prompt responses to disasters. Additionally, the Solomon Islands actively engages in regional and international partnerships, collaborating with international organizations such as the United Nations, the World Bank, and neighboring countries to bolster its disaster risk management capabilities
Drinking Water Supply
The Solomon Islands Water Authority (SIWA) is a government-owned entity responsible for the management and provision of water services for the majority of the population in the Solomon Islands, including those residing in informal settlements. However, access to safe and reliable drinking water remains a pressing concern. Recent estimates reveal that approximately 41% of Honiara’s population lacks access to the city’s public water supply system, while approximately 24% lack access to basic sanitation facilities. Furthermore, the nation’s water sources face significant challenges in terms of sustainability and vulnerability to natural disasters. The Solomon Islands frequently experiences cyclones and earthquakes, which pose a constant threat to the country’s water supply infrastructure, particularly in urban areas. To address these challenges, the government, in collaboration with international organizations, has initiated the Urban Water Supply and Sanitation Sector Project. This project aims to enhance and expand critical water and sewerage infrastructure, ultimately increasing SIWA’s coverage to encompass 65% of the population, while reducing SIWA’s non-revenue water.
Urban Roads & Transport
Ensuring the provision of safe and efficient road and transport infrastructure is crucial to meet the needs of Honiara’s growing population. However, there is significant variation in the quality of roads throughout the city. While there are paved roads in Honiara and other major towns, the majority of roads are composed of coral, gravel, or dirt, which lack adequate lighting. In the outlying islands, road infrastructure is scarce or non-existent, with transportation options limited to walking trails or the use of outboard motor canoes. Public transportation mainly relies on buses and taxis, although accessibility to these services is limited outside of the capital. Recognizing the importance of enhancing road and transportation infrastructure, the Government, in collaboration with international organizations, has initiated two key projects: the Solomon Island Road Improvement Project and the Greater Honiara Transport Master Plan Study. These efforts aim to enhance connectivity and accessibility across Honiara, with a specific focus on fortifying climate resilience and adapting to the impacts of climate change.
Solid Waste Management
Solid waste management is a pressing environmental challenge in the Solomon Islands, driven by limited land resources, population growth, and urbanization. It is estimated that the urban area of Honiara produces approximately 80 tons of household waste daily, a significant amount for a small island state. The Honiara City Council (HCC) Environmental Division is responsible for waste collection, but less than half of the population benefits from this service. Moreover, the HCC’s waste collection services do not extend to the extensive informal settlements beyond the municipal boundary, exacerbating issues like littering, illegal dumping, and widespread burning. These practices pose significant risks to both the environment and public health. Enhancing solid waste management in Honiara offers considerable potential for improvement, particularly by extending service coverage to encompass the entire urban population, including peri-urban areas. However, a key hurdle in achieving this goal is the lack of funding allocated for adequate solid waste management, compounded by the fact that a significant number of informal settlers do not contribute council rates.
Local Administration
The Solomon Islands is a constitutional monarchy with three tiers of government: national, provincial and local. The prime minister serves as the head of government and is accountable to a unicameral parliament. The Local Government Act (LGA) of 1996 empowers the Minister for Home Affairs to establish local government councils, defining their powers and responsibilities. However, at present, the Honiara City Council stands as the sole local government body in the Solomon Islands, established separately under the Honiara City Act (HCA) of 1999. The country encompasses nine provincial governments referred to as assemblies, each incorporating multiple wards based on population size. The Honiara City Council consists of 20 councilors who collectively govern the city. This council includes 12 elected representatives, each assigned to specific wards, as well as four members appointed by the minister. Additionally, three members of parliament representing Honiara and the premier of Guadalcanal province, which encompasses the island hosting Honiara, are also part of the council. However, it’s important to note that as of July 1983, Honiara was designated as a separately-administered Capital Territory and is no longer considered part of the Guadalcanal province.
City Population, 2019; UN-Habitat, 2012; International Monetary Fund, 2023. Land Administration: UN-Habitat, 2012. Housing: ABC, 2017; Devpolicy Blog, 2017; UN-Habitat, 2012; UN-Habitat, 2020. Energy: Solomon Islands Government, 2022. Disaster Risk Management: UNDRR, 2023. Water: Asian Development Bank, n.d. Roads and Transport: Digital Logistics Capacity Assessments, n.d.; Solomon Islands Ministry of Infrastructure Development, 2022. Solid Waste Management: UN-Habitat, 2012; Asian Development Bank, 2014. Local Administration: Clgf, n.d
Key Considerations for Investment Planning & Prioritization
Concluding Questions
What is the most surprising result for you in this City Scan?
What patterns did this City Scan illuminate that you had not considered before?
What are your city’s critical development challenges?
What other information would you like in order to corroborate or amplify the information in this City Scan?
Who else would you like to speak with to gain further understanding about your city’s development challenges?
What investments need to be prioritized? What trade-offs are inherent in your prioritization?
What investments could be coordinated? What benefits would such coordination bring?