Port Moresby, Papua New Guinea
Port Moresby, Papua New Guinea
City Scan
May 2025
![]()
![]()
![]()
![]()
Executive Summary
Setting the Context
Port Moresby is the capital and largest city of Papua New Guinea (PNG). With a population of close to 400,000 people, Port Moresby is a bustling urban center and the political, economic, and administrative center of the country. The local economy of Port Moresby is primarily driven by government services, trade, and the extractive industries. Despite its immense economic potential, the city faces challenges related to urban development, such as insufficient infrastructure, housing shortages, and social unrest.
Population and Demographic Trends
Port Moresby’s population increased by 58% from 285,191 in 2000 to 450 977 in 2021, at an average annual rate of 2.2%. With an area of 266 km2, Port Moresby has a population density of 1,695 people per km2. Port Moresby’s population distribution is considerably younger than the median regional benchmark city.
City Competitiveness and Economic Activity
Port Moresby represents 4.9% of Papua New Guinea’s population, but over 7% of its GDP. Since 2000, its GDP has grown at an annual average rate of 4.7%. In terms of GDP per capita, Port Moresby’s growth has been gradual, behind that of many benchmark cities. Within the city, the economic activities around the neighborhood of Gordon have become less intense in recent years, while those outside the city center have been growing.
Built Form
Almost all of the city’s built-up area pre-dates 1985. Tree cover is the largest land class and covers 77% of all land, and built-up area is the next largest class. The road network of Port Moresby shows no clear directional pattern; the streets extend in all different directions around the city, indicating a more organic development pattern. Certain parts of the city have poor access to infrastructure like schools and health facilities.
Climate Conditions
PV power potential in Port Moresby is moderate, but seasonality is very low, which makes solar electricity more feasible. There is moderate air pollution in the city center. The ample green spaces throughout the city may have contributed to the absence of the urban heat island effect.
Risk Identification
The primary hazards confronting Port Moresby are rainwater flooding and sea level rise. 19% of Port Moresby’s most populated areas are within the rainwater flood risk zone with a minimum depth of 15 cm, and populated areas along the coastline are already being impacted by sea level rise. Seismic hazard is also significant, as average annual loss from earthquakes is estimated at $5,000–10,000 per m².
Local Institutions and Planning
Port Moresby is governed by the National Capital District Commission (NCDC), which is responsible for the overall administration and development of the city. The Department of Provincial and Local Government Affairs (DPLGA) has ministerial oversight on all matters relating to local government, including local taxes and budgets. Spatial planning in Port Moresby faces several challenges, such as weak institutional capacity, insufficient funding, a lack of regulatory authority and limited participatory planning processes.Setting the Context
Basic City Information
Port Moresby is the capital and largest city of Papua New Guinea (PNG), located on the country’s southeastern coast. The city occupies a strategic position within the Pacific region, as it serves as the main transportation hub and gateway to PNG. With a population of close to 400,000 people, Port Moresby is the political, economic, and administrative center of the country.
The local economy of Port Moresby is primarily driven by government services, trade, and the extractive industries. As the capital city, it hosts government offices and headquarters of various national and international organizations. Moreover, Port Moresby acts as a prominent commercial and financial hub, accommodating a diverse range of businesses and services that cater to both local and international markets. As the primary seaport of PNG, the city plays a crucial role in facilitating regional trade and commerce with neighboring countries. Leveraging its abundant natural resources, Port Moresby provides vital support to the industry through logistics, administration, and business services.
Despite its immense economic potential, the city faces challenges related to urban development, such as insufficient infrastructure, housing shortages, and social unrest. These issues, combined with environmental issues related to climate change, deforestation, extraction and pollution, present significant barriers to the city’s long-term growth and prosperity.
The boundary lines mark the area of interest for the City Scan. These lines may differ from the city’s official administrative boundaries and may include multiple jurisdictions.
Population and Demographic Trends
Population Density
- Port Moresby’s population is very evenly spread across most the city
- Some higher density areas are located in the eastern and northern outskirts, contrary to the typical urban agglomeration pattern
This map estimates population numbers per 10,000 m2 grid cell. It provides a more consistent representation of population distributions across different landscapes than administrative unit counts. Knowing where people are is critical for impact assessments and intervention plans, especially those focused on service delivery, food security, climate change, network systems and natural disasters.
Population Growth
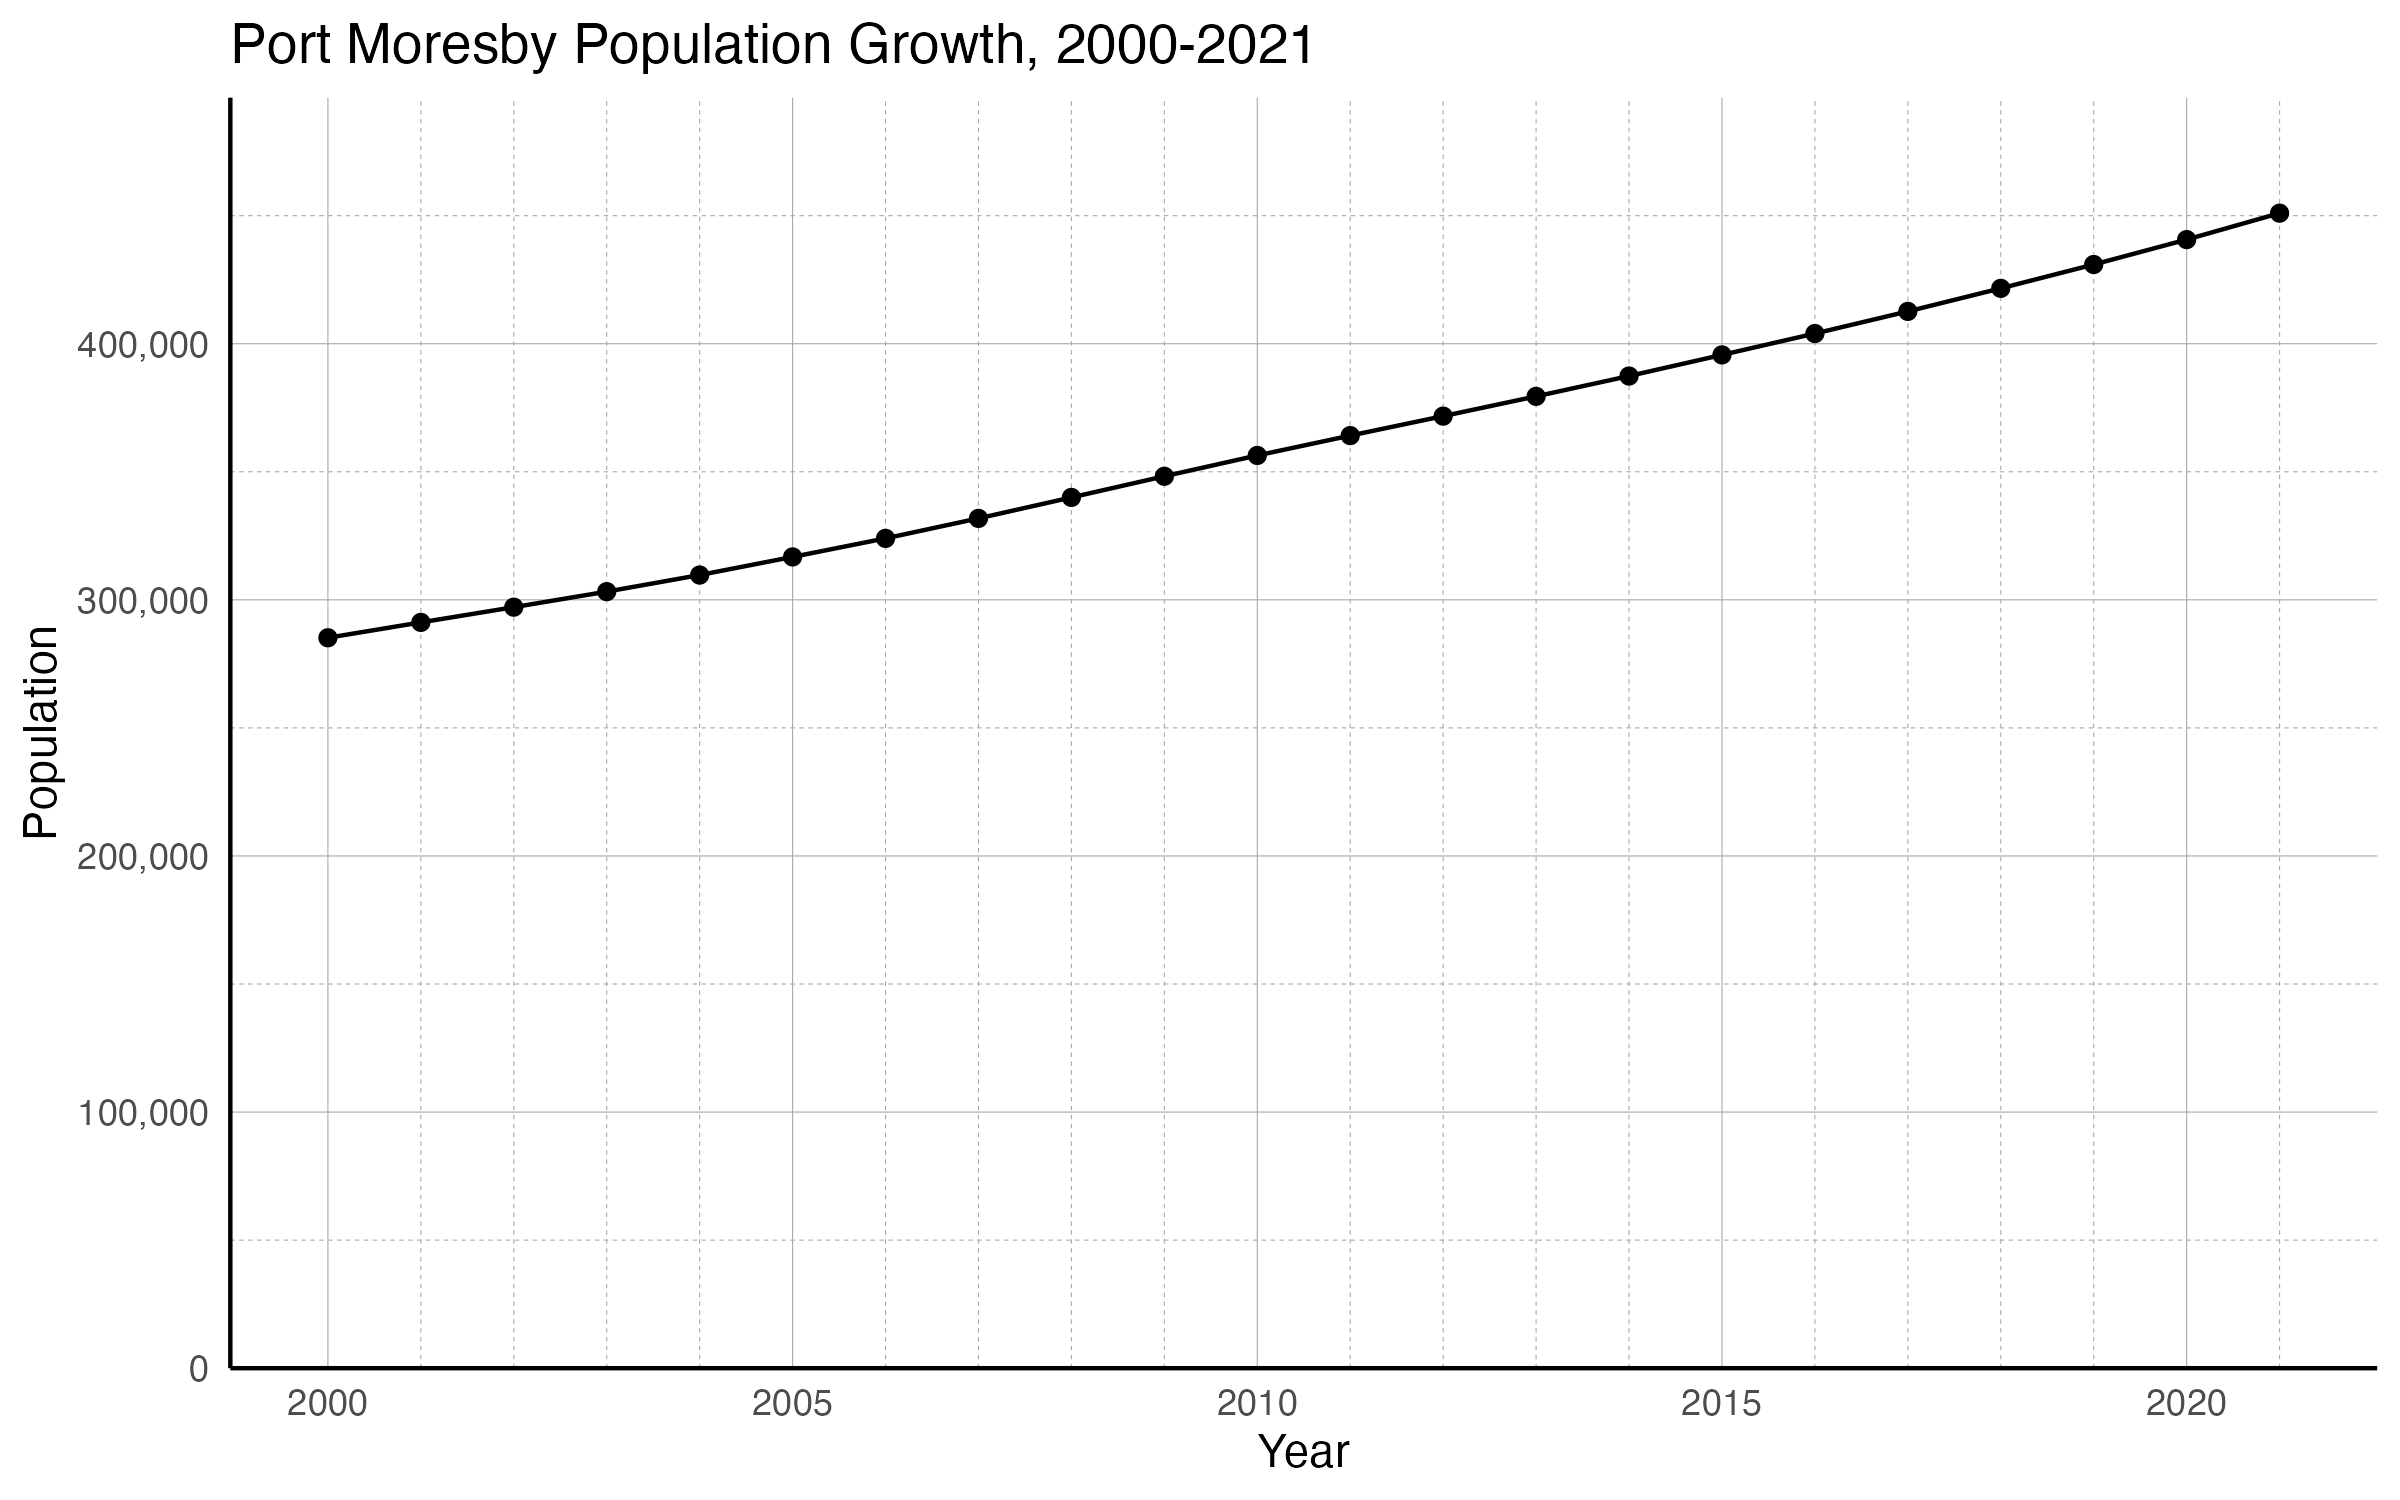
- Port Moresby’s population increased by 58% from 285,191 in 2000 to 450 977 in 2021, at an average annual rate of 2.2%
- Population growth has been very steady over the years, with annual growth rates ranging from 2.0% to 2.5%
Population figures are typically used as a denominator for many indicators, and are a measure of demand for services. The line chart above summarizes the city’s population change according to census and other public data. High growth of urban populations, caused by rates of natural increase (more births than deaths) in urban areas, migration from rural to urban areas, and the transformation of rural settlements into urban places, puts pressure on cities to meet the new demand.
Population Density
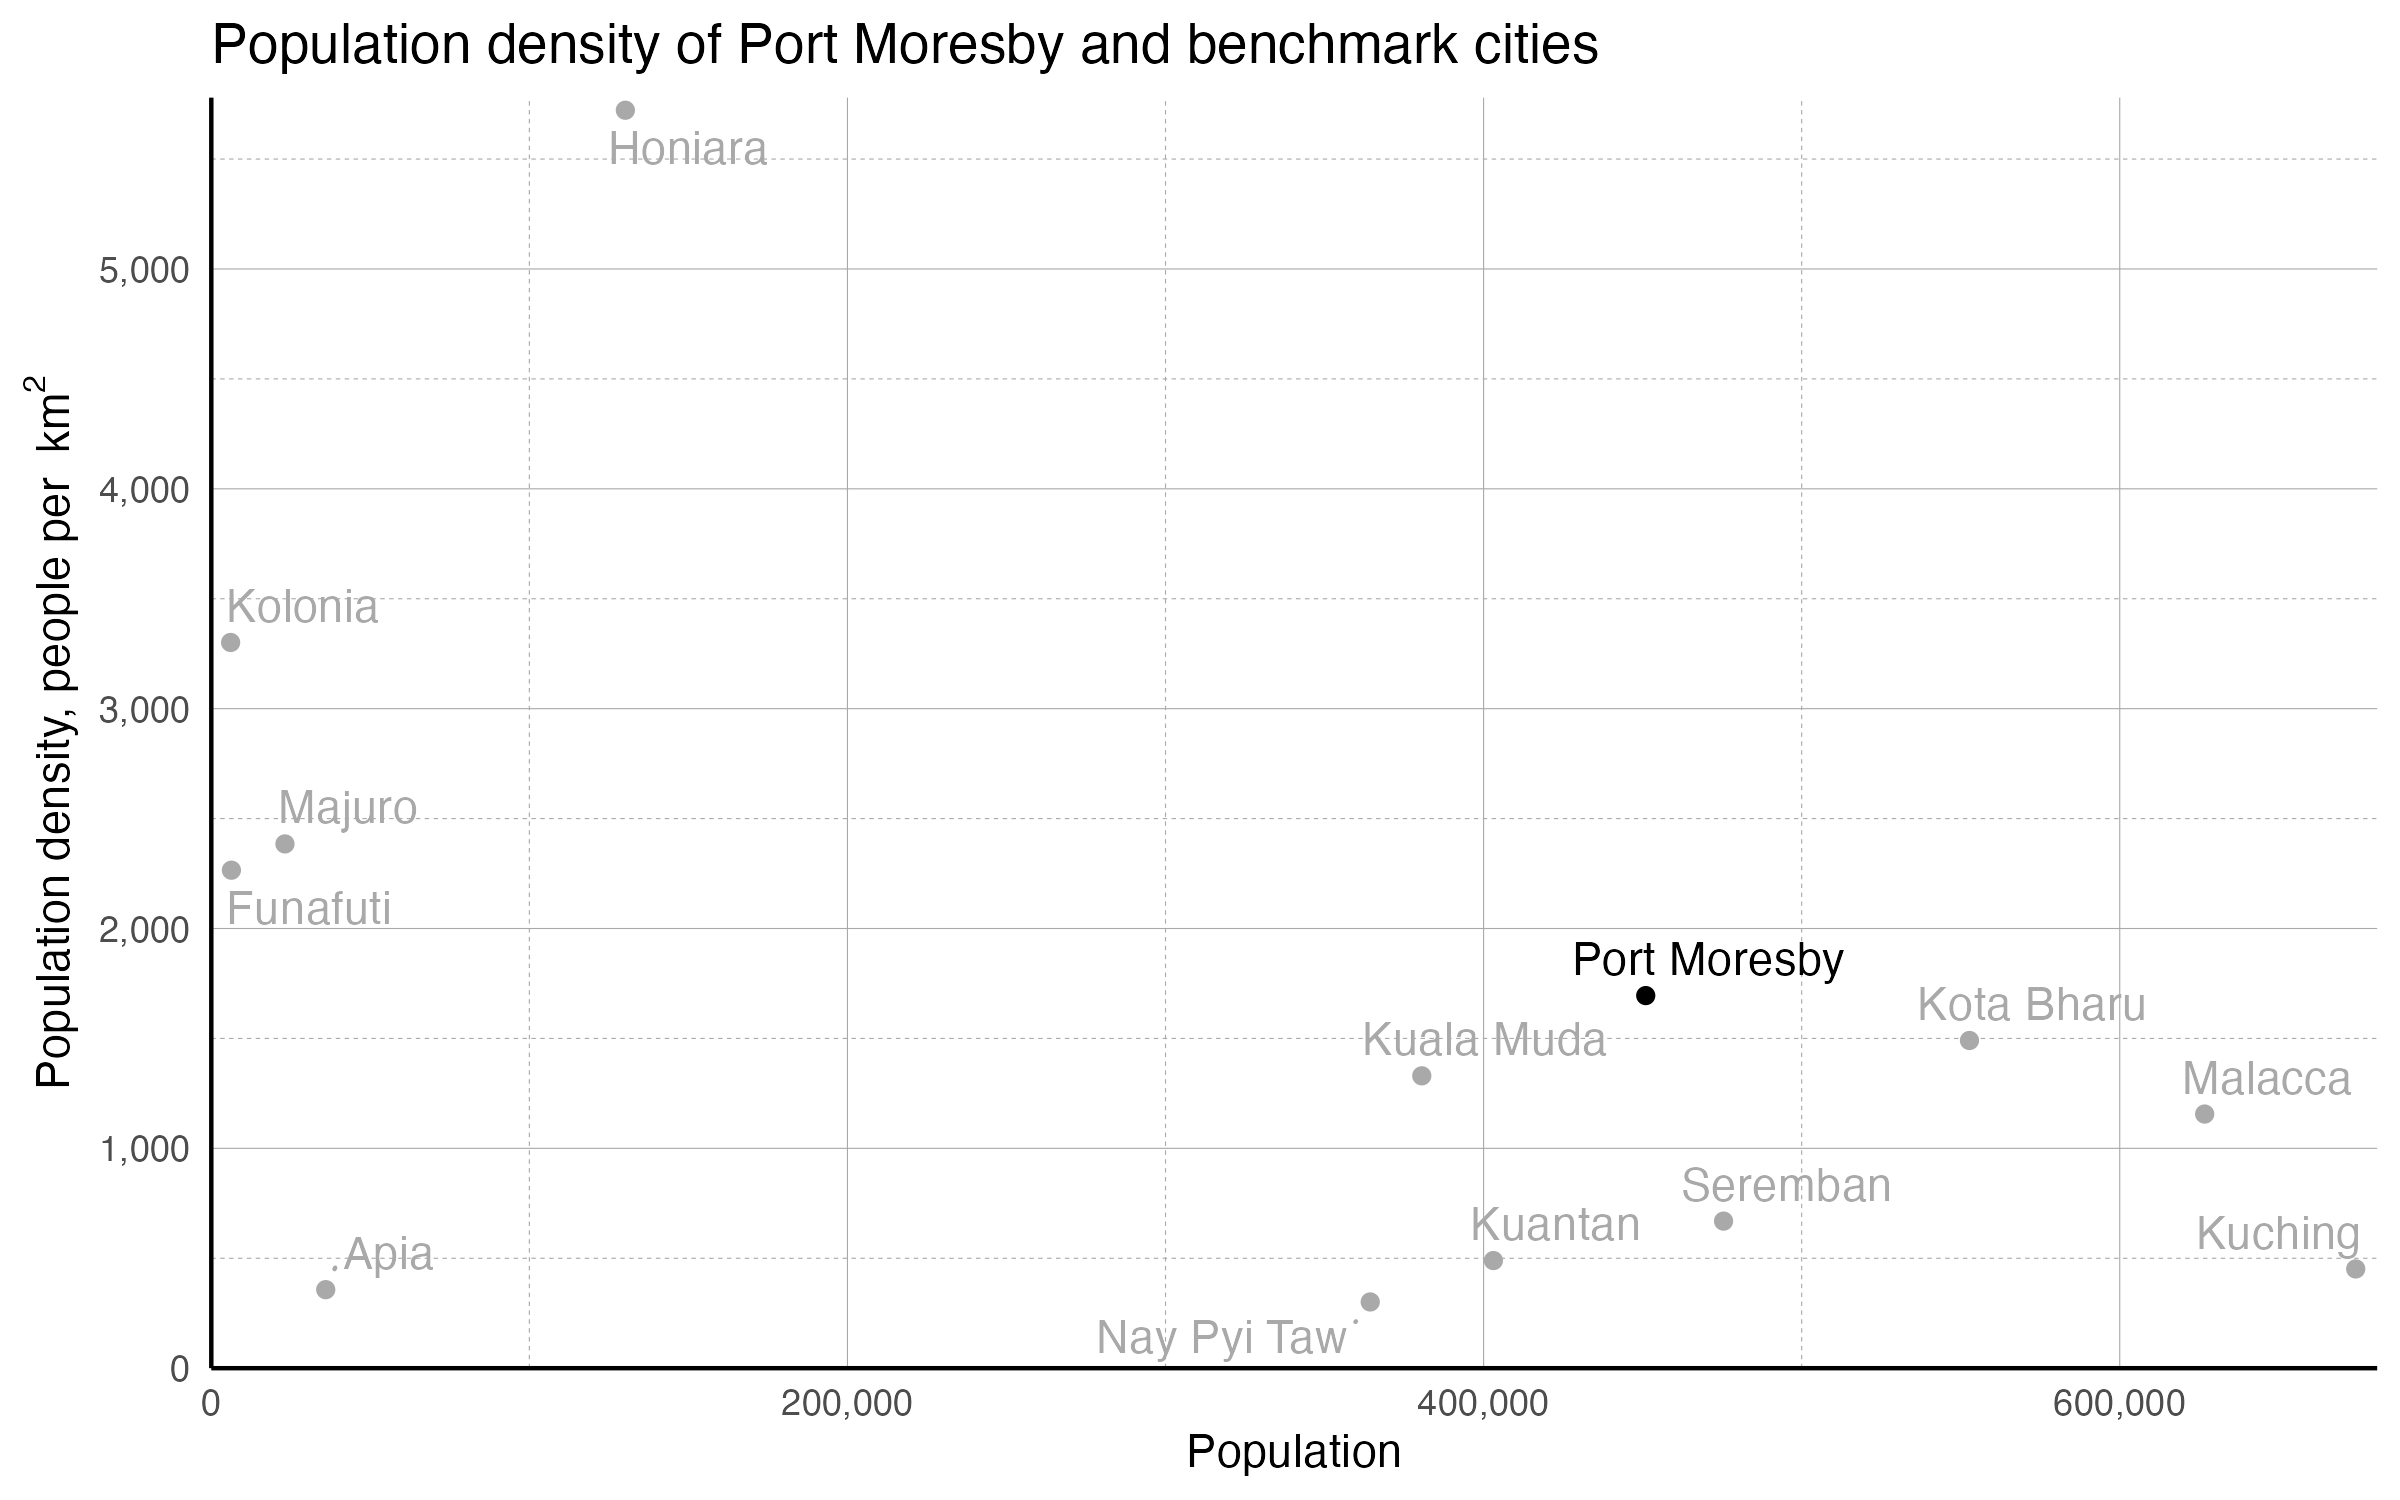
- With an area of 266 km2, Port Moresby has a population density of 1,695 people per km2
- Among the 12 regional benchmark cities, Port Moresby has the 4th highest density
Density is calculated using the most recent census population recorded and the official land area occupied by the city, and is an important measure of how cities function. Higher population density enables governments to more easily deliver essential infrastructure and services in urban areas at relatively low cost per capita. However, such benefits do not materialize automatically or inevitably. Whether a city’s population dynamics pose challenges or offer opportunities typically depends on the policies in play.
Populations and area are from Oxford, 2022, “Oxford Economics” or CityPopulation.de. Note that Oxford Economics uses quite large extents for its cities, meaning that the measured density is likely considerably lower than the density experienced by most inhabitants of the cities. Extents used by the both data sources may differ from the AOIs used by the City Scans.
Population Distribution by Age & Sex
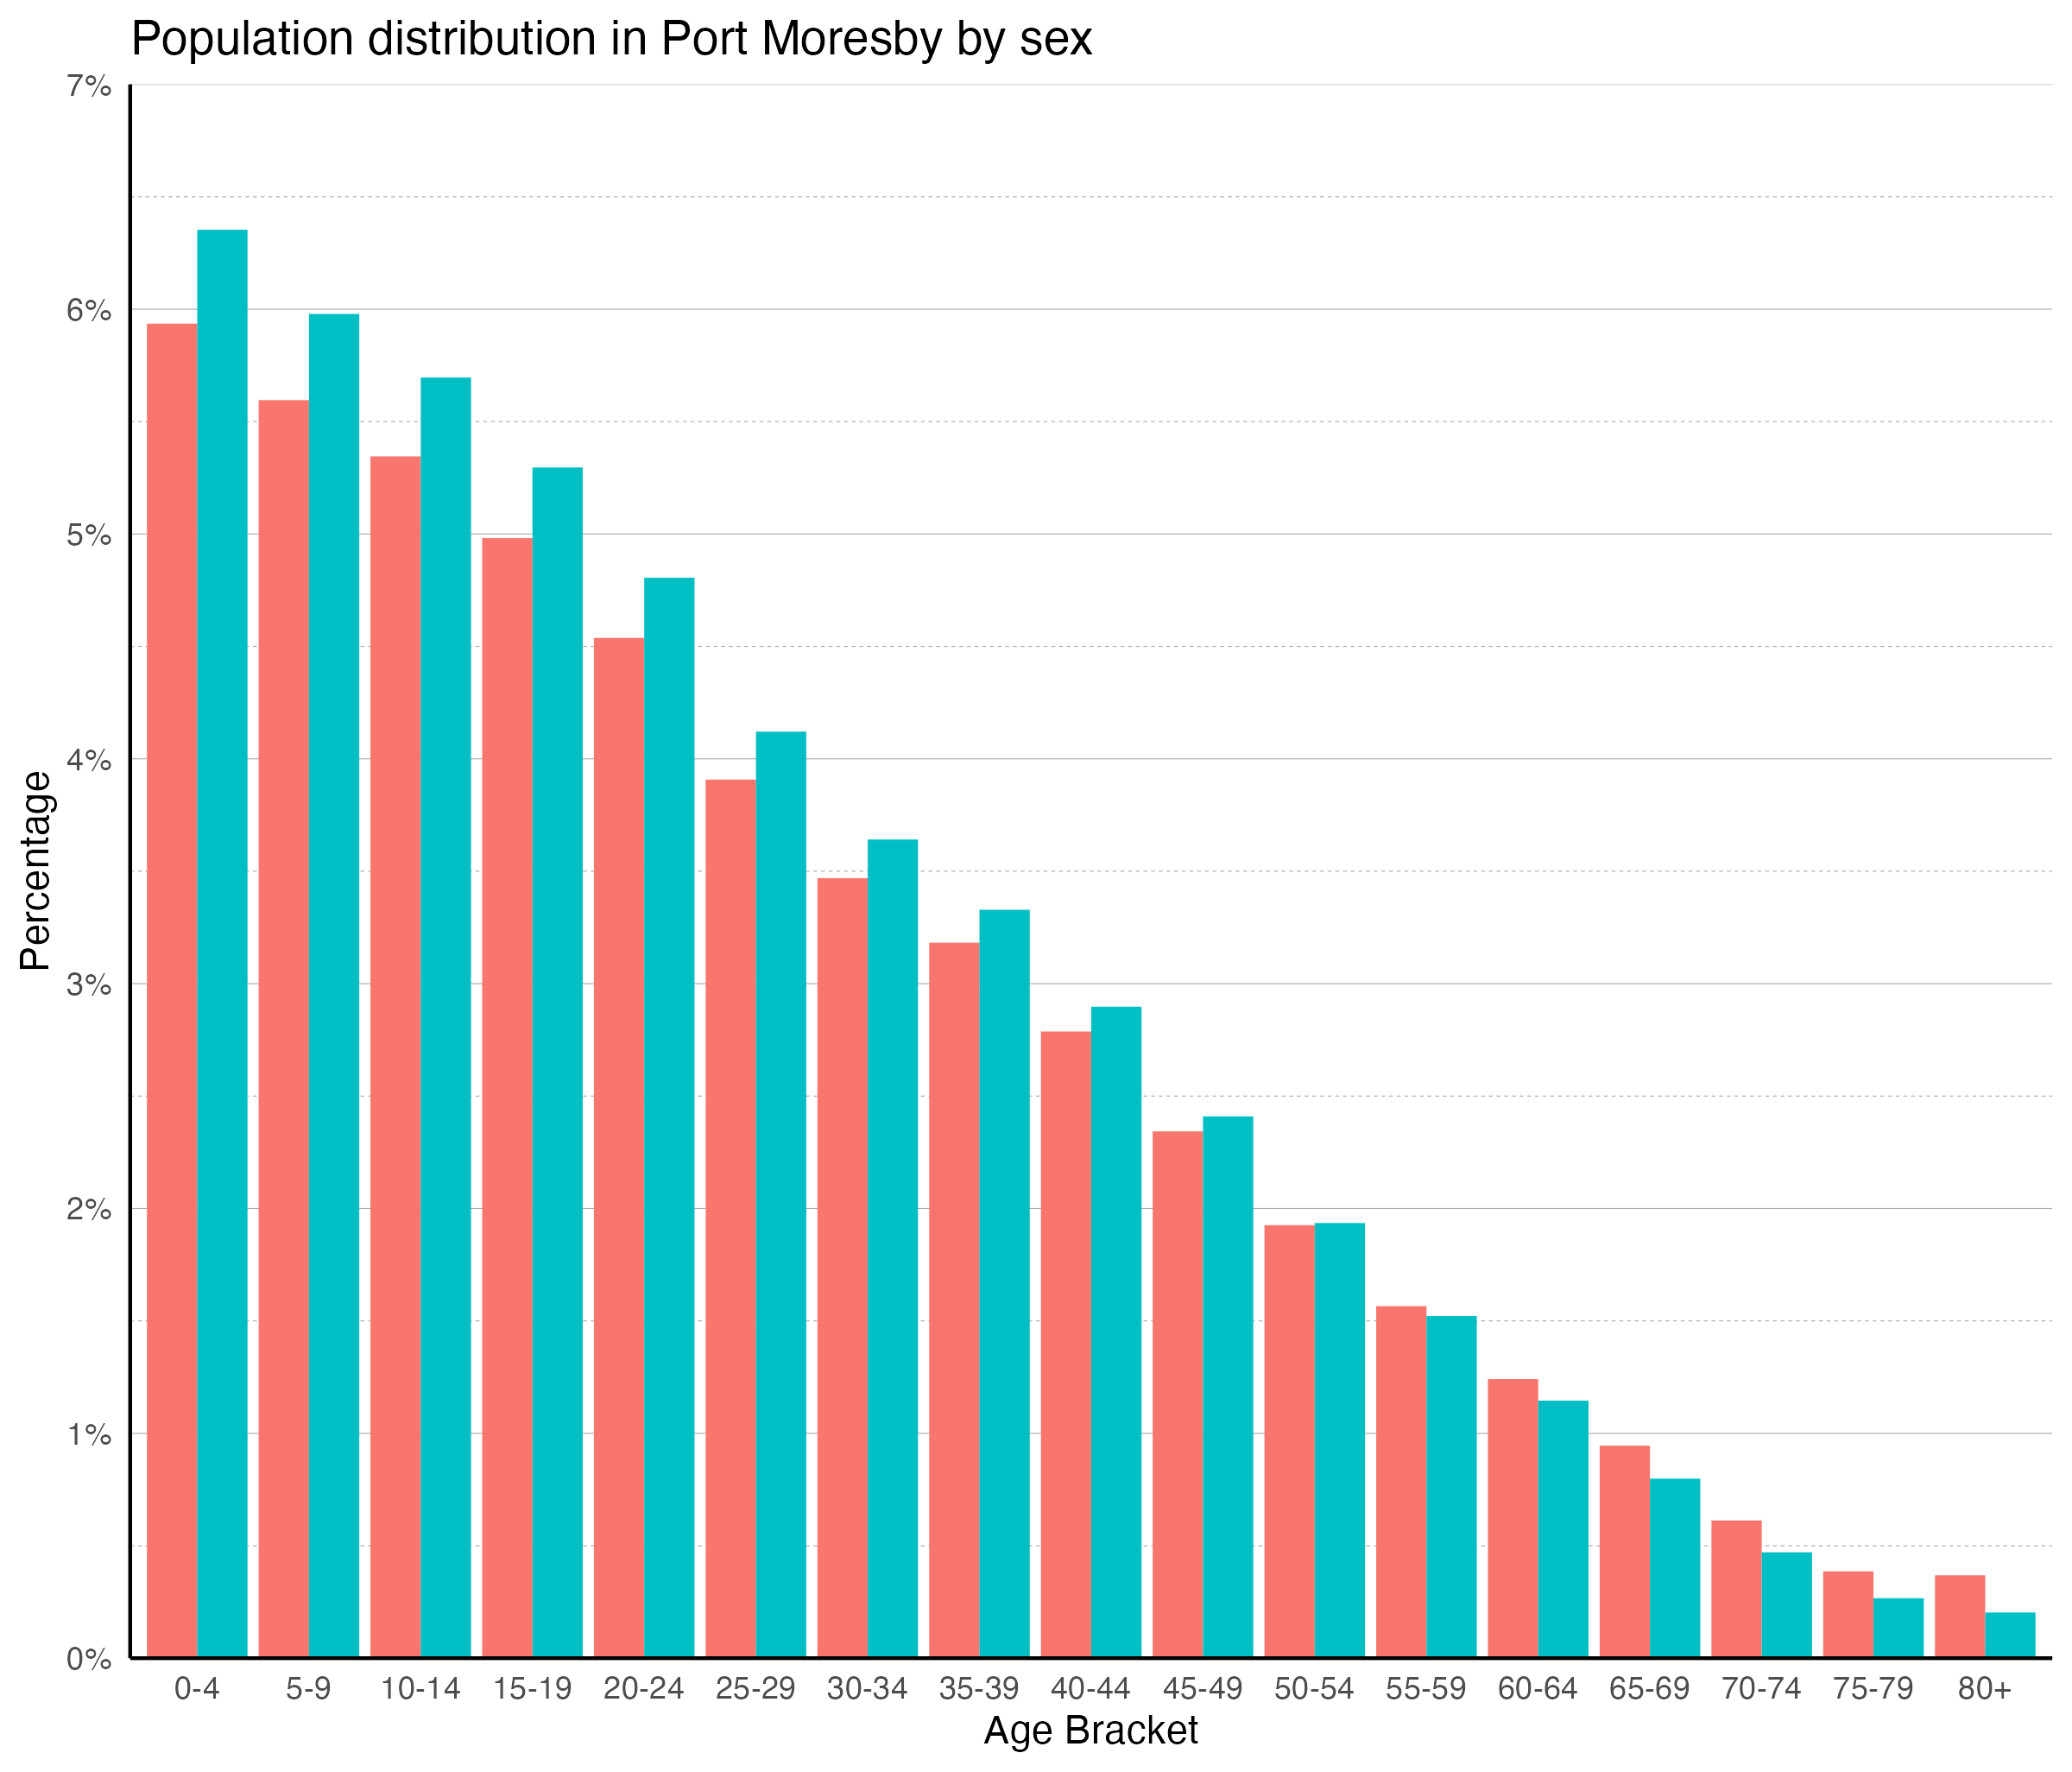
- Port Moresby’s population distribution is considerably younger than the median regional benchmark city
- Unlike the median city, the largest age groups are of people aged 0-4 (13.5% of the total population)
- In 2000, 54% of the population was working-age (15-64)
- The median female in Port Moresby is older than the median male
- The largest age groups for both males and females are ages 0–4
- There are more men than women in Port Moresby: there are 104 men to every 100 women
- 51% of all women in Port Moresby are of reproductive age
This column chart classifies the city’s population according to age group, forming the basis of population projections. Populations vary significantly in their proportions of young and old people, with growing populations generally appearing younger, and declining or slowly growing populations generally appearing older.
Data from WorldPop. Bondarenko, et al, Estimates of total number of people per grid square broken down by gender and age groupings for 51 countries across sub-Saharan Africa in 2020 using Ecopia.AI and Maxar Technologies building footprints, 2020.
Reproductive age is defined as 15–49. Working age is defined as 15–64.
Economic Activity
Economic Hotspots
- There are two main nodes of economic activity in the city: the neighborhoods of Gordon and Port Moresby
- Economic activities decline as the distance from city center increases
This map measures the total emissions of nighttime lights from the monthly average of radiance for 2014 through 2022. Nighttime light radiance is a common proxy for economic activity: where there is more artificial light, there is generally more commercial activity. VIIRS observations are made fairly late at night, as its satellites cross the equator at around 1:30 local time; thus, the observed lights are typically street lights and nights which are left lit all night long. The correlation of nighttime light and economic activity is strongest for urban areas; it is less relevant in agricultural areas and areas with very low population density.
Map data from NOAA, “VIIRS Daily Mosaic”.
Change in Economic Hotspots
- The economic activities around the neighborhood of Gordon have become less intense in recent years, while those outside the city center have been growing
- The Port Moresby neighborhood has among the fastest growth in economic activities in the city
The map illustrates monthly temporal changes from 2014 to 2022 in the emission of nighttime lights, indicating changes in economic activity. Positive values represent an increase in the intensity of nighttime light emission and, by proxy, economic activity, while negative values represent a decrease in the intensity of nighttime light emission, and economic activity.
Map data from NOAA, “VIIRS Daily Mosaic”.
Built Form
Urban Extent and Change
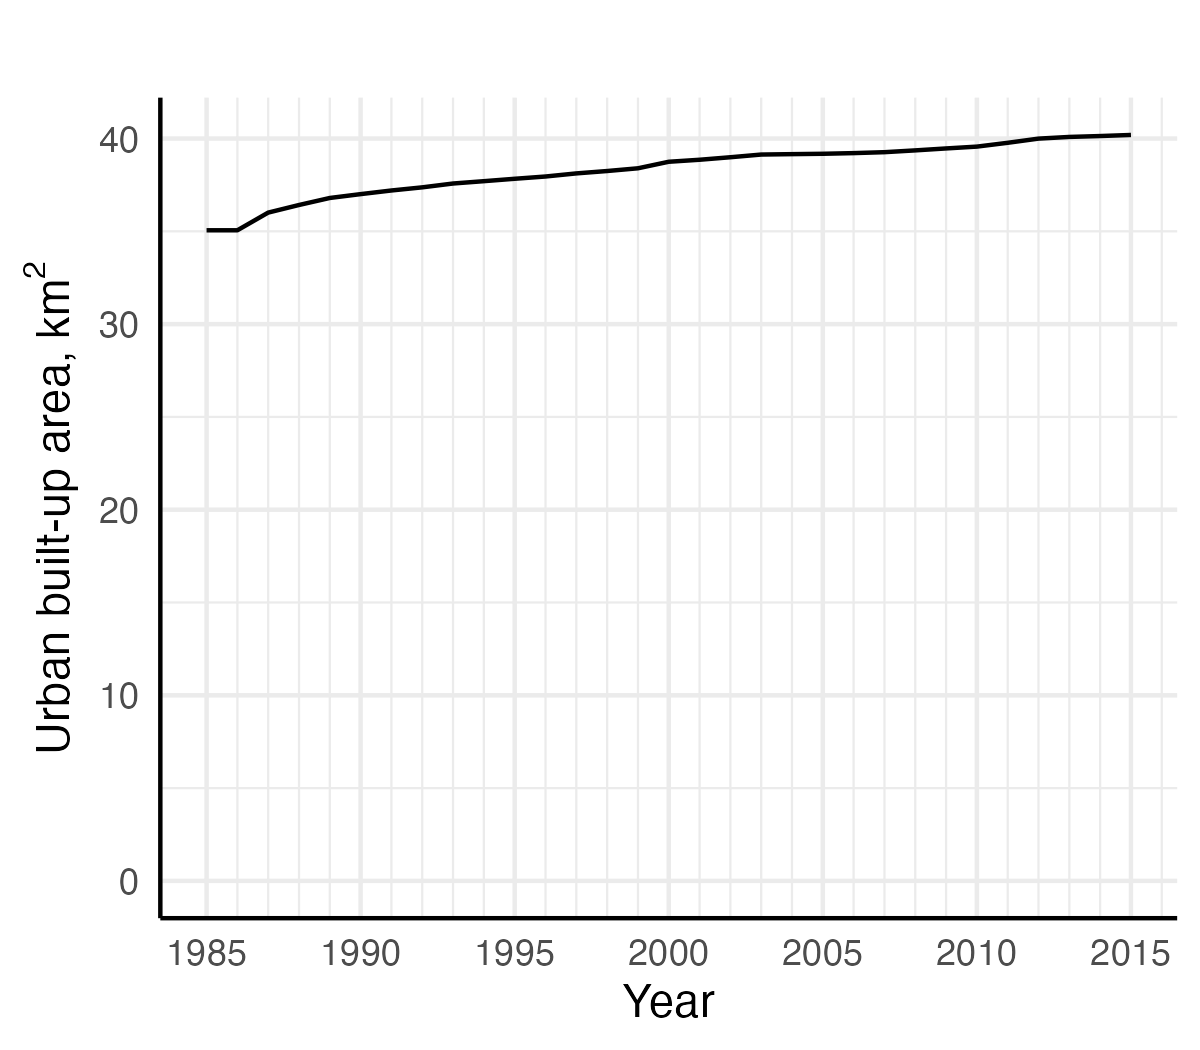
- Almost all of the city’s built-up area predates 1985
- The city’s built-up area grew from 35 km2 in 1985 to 40 in 2015, a 15% growth
- The built-up area growth has taken place relatively evenly across the city
- Population growth and rural-tourban migration have been the main contributing factors to urban expansion
Map data from DLR, 2015, “World Settlement Footprint Evolution - Landsat 5/7 - Global”.
Land Cover
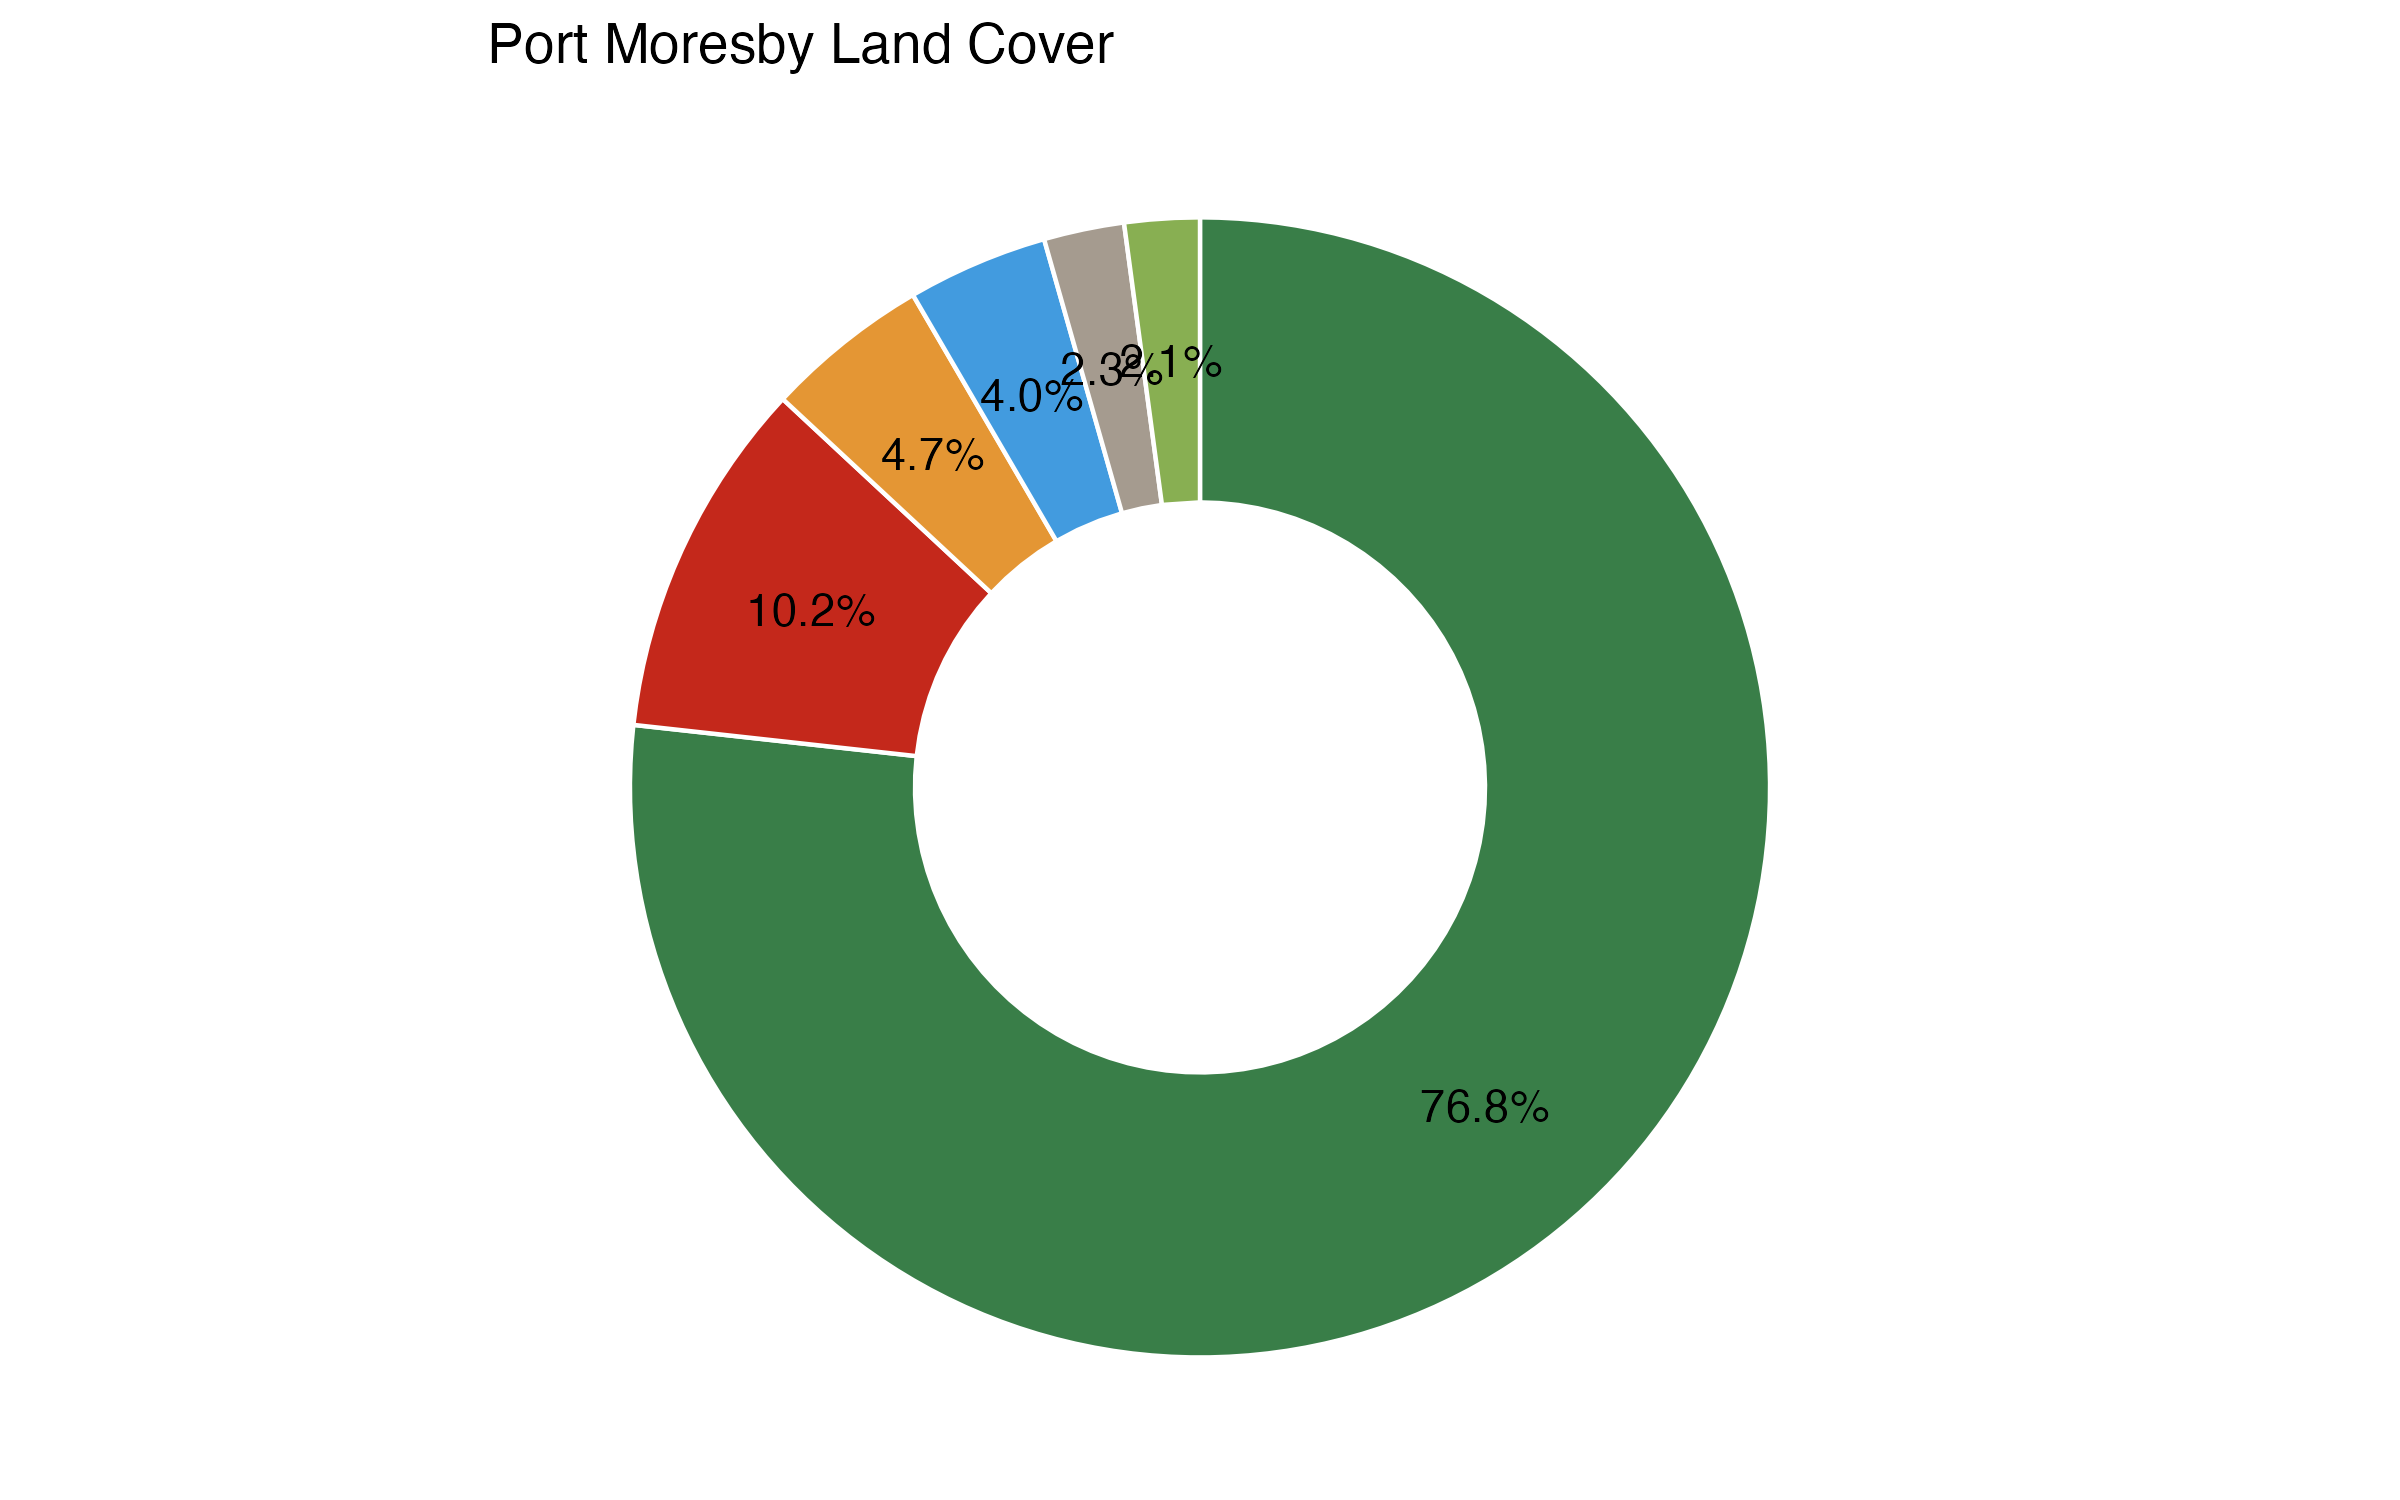
- Tree cover is the largest land class and covers 77% of all land
- Built-up area is the next largest class, and comprises 44% of the remaining land
- The next largest classes are cropland and water bodies
Land cover refers to the ground surface cover, including vegetation, urban infrastructure, water, and bare soil, among other classifications. Identifying land cover type helps to understand land utilization and inform planning policies and programs.
© ESA WorldCover project 2020 / Contains modified Copernicus Sentinel data (2020) processed by ESA WorldCover consortium’
Access to Schools
- Schools are well distributed throughout most of Port Moresby
- Most built-up area is within a 2.4- km journey to a school, but places around the Fairfax Harbour and the airport have poor access to schools
Using a proximity analysis along the existing road network, this map identifies the areas that are most- and least-accessible to schools. The analysis includes all facilities classified in OpenStreetMap as a school, kindergarten, college or university. Note that there may be more schools that are not included in OpenStreetMap.
Map data from OpenStreetMap and DLR, 2015.
Access to Health Facilities
- Health facilities are slightly concentrated in several neighborhoods in the city center and the northern part of the city
- Residents of many built-up areas, including ones that are relatively centrally located, have to travel more than 3km to a health facility
Using a proximity analysis along the existing road network, this map identifies the areas that are most- and least-accessible to schools. The analysis includes all facilities classified in OpenStreetMap as a health amenity, clinic, or hospital. Note that there may be more health facilities that are not included in OpenStreetMap.
Map data from OpenStreetMap and DLR, 2015.
Climate Conditions
Solar Photovoltaic Potential
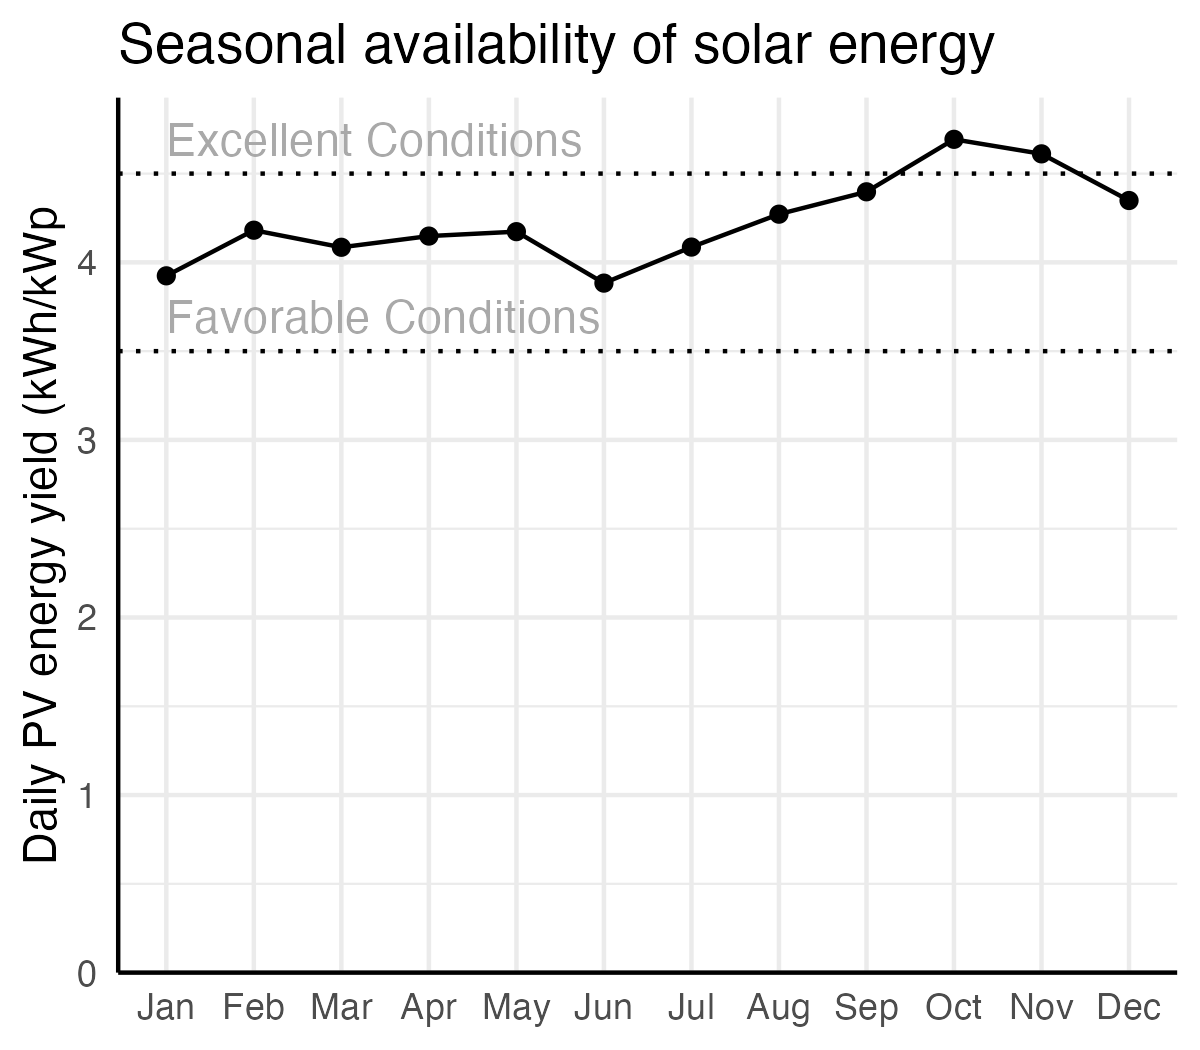
- PV power potential in Port Moresby is moderate (1,468–1,639 kWh/kWp annually)
- But seasonality is very low, with favorable to excellent conditions in every month, which makes solar electricity more feasible
- Solar power is most available in the south
Solar electricity offers a unique opportunity to achieve long-term energy sustainability goals. Photovoltaics (PV) is the most widely applied and versatile technology for solar power. The availability of solar energy depends on site conditions. This map displays an indicative estimate of daily specific yield, that is, how much energy a hypothetical PV system would produce for per unit of capacity (kWh/kWp). Values above 4.5 are considered excellent availability, while values between 3.5 and 4.5 are moderate.
Map data obtained from the “Global Solar Atlas 2.0, a free, web-based application is developed and operated by the company Solargis s.r.o. on behalf of the World Bank Group, utilizing Solargis data, with funding provided by the Energy Sector Management Assistance Program (ESMAP). For additional information: https://globalsolaratlas.info
The Global Solar Atlas uses generalized theoretical settings for a quick assessment of PV power potential for a selected site. An optimum tilt angle of PV modules and 100% availability (no shutdowns due to failure) are assumed.
Air Quality
- Air quality is lowest in the city center
- The concentration of PM2.5 in Port Moresby is 10-15 μg/m3 in the city center and below 10 in the outskirts
- Air quality in the more urbanized areas is worse than the WHO safety standards of 5 μg/m3 of PM2.5
The concentration of particulate matter (PM) is a key indicator of air quality since it is the most common air pollutant affecting short and long-term health. This map displays the average annual concentration (µg per m3) of ground-level fine particulate matter of 2.5 micrometers or smaller (PM2.5).
PM2.5 particles are of greater concern than PM10 particles because their small size allows them to travel deeper into the cardiopulmonary system. According to the WHO and the United States EPA standards, PM2.5 concentrations should not exceed between 5 µg/m3 or 12 µg/m3, respectively. Higher concentrations of particulate matter may also reduce the availability of solar energy.
PM2.5 Grids are derived using annual data from 1998-2019 represent near-surface concentrations.
Map data from Hammer, 2022, “Global Annual PM2.5 Grids”.
Summer Surface Temperature
- There is not a clear pattern of Urban Heat Island (UHI) effect based on the average surface temperatures in Port Moresby
- Highest temperatures are found in the city center and some of the periurban areas alike
Temperatures in an area are affected by many factors, such as land cover, elevation, slope, and proximity to water. Higher temperatures can generate or exacerbate negative effects related to health, social equity, and economic productivity. Typically, cities demonstrate higher temperatures than vegetated areas: construction materials, such as concrete, absorb more solar radiation; less vegetation results in less evapotranspiration; and more vehicle usage and mechanical cooling generate more heat.
This map shows average surface temperatures from June through September, 2014–2023, at a 30-meter resolution. Note that it measures surface temperature rather than ambient temperature, which can differ by several degrees. Surface temperature is primarily useful for identifying hotter and cooler areas within a specific geography.
Landsat Level 2 Surface Temperature Science Product courtesy of the U.S. Geological Survey.
Vegetated Areas
- There are abundant green spaces across Port Moresby, especially outside of the urban core
This map displays the Normalized Difference Vegetation Index, which ranges between -1 and 1, with higher numbers indicating a higher density of green vegetation. Values of less than 0.1 typically indicate water, rock, and otherwise barren land; values of 0.1 to 0.3 are associated with shrubs and grassland; 0.3 to 0.5 corresponds to moderate vegetation; and values of more than 0.5 correspond to dense vegetation such as forests or mature crops.
Vegetation and green spaces in cities are associated with health benefits and the mitigation of environmental risks. More green space in a city can reduce temperatures and the urban heat island effect, lessen air pollution, and absorb floodwaters. Green spaces can also serve important civic, social, and quality of life functions.
Map data from European Space Agency, 2020, “Normalized Difference Vegetation Index”.
NDVI-based measures do not account for the proximity and spatial arrangement of green spaces within areal units. They also do not address the vertical dimension and density of green urban buildup.
Forests & Deforestation
Loss of forest areas and wetlands in urban catchments contributes to a reduction in green land cover. As soils are then more likely to be saturated with water, more precipitation runs off, increasing the risk of flash flooding. Halting the loss and degradation of natural systems and promoting their restoration can therefore be critical.
Map data from Hansen/UMD/Google/USGS/NASA, at 1 arcsecond resolution. Trees are defined as vegetation taller than 5 meters.
Risk Identification
Elevation
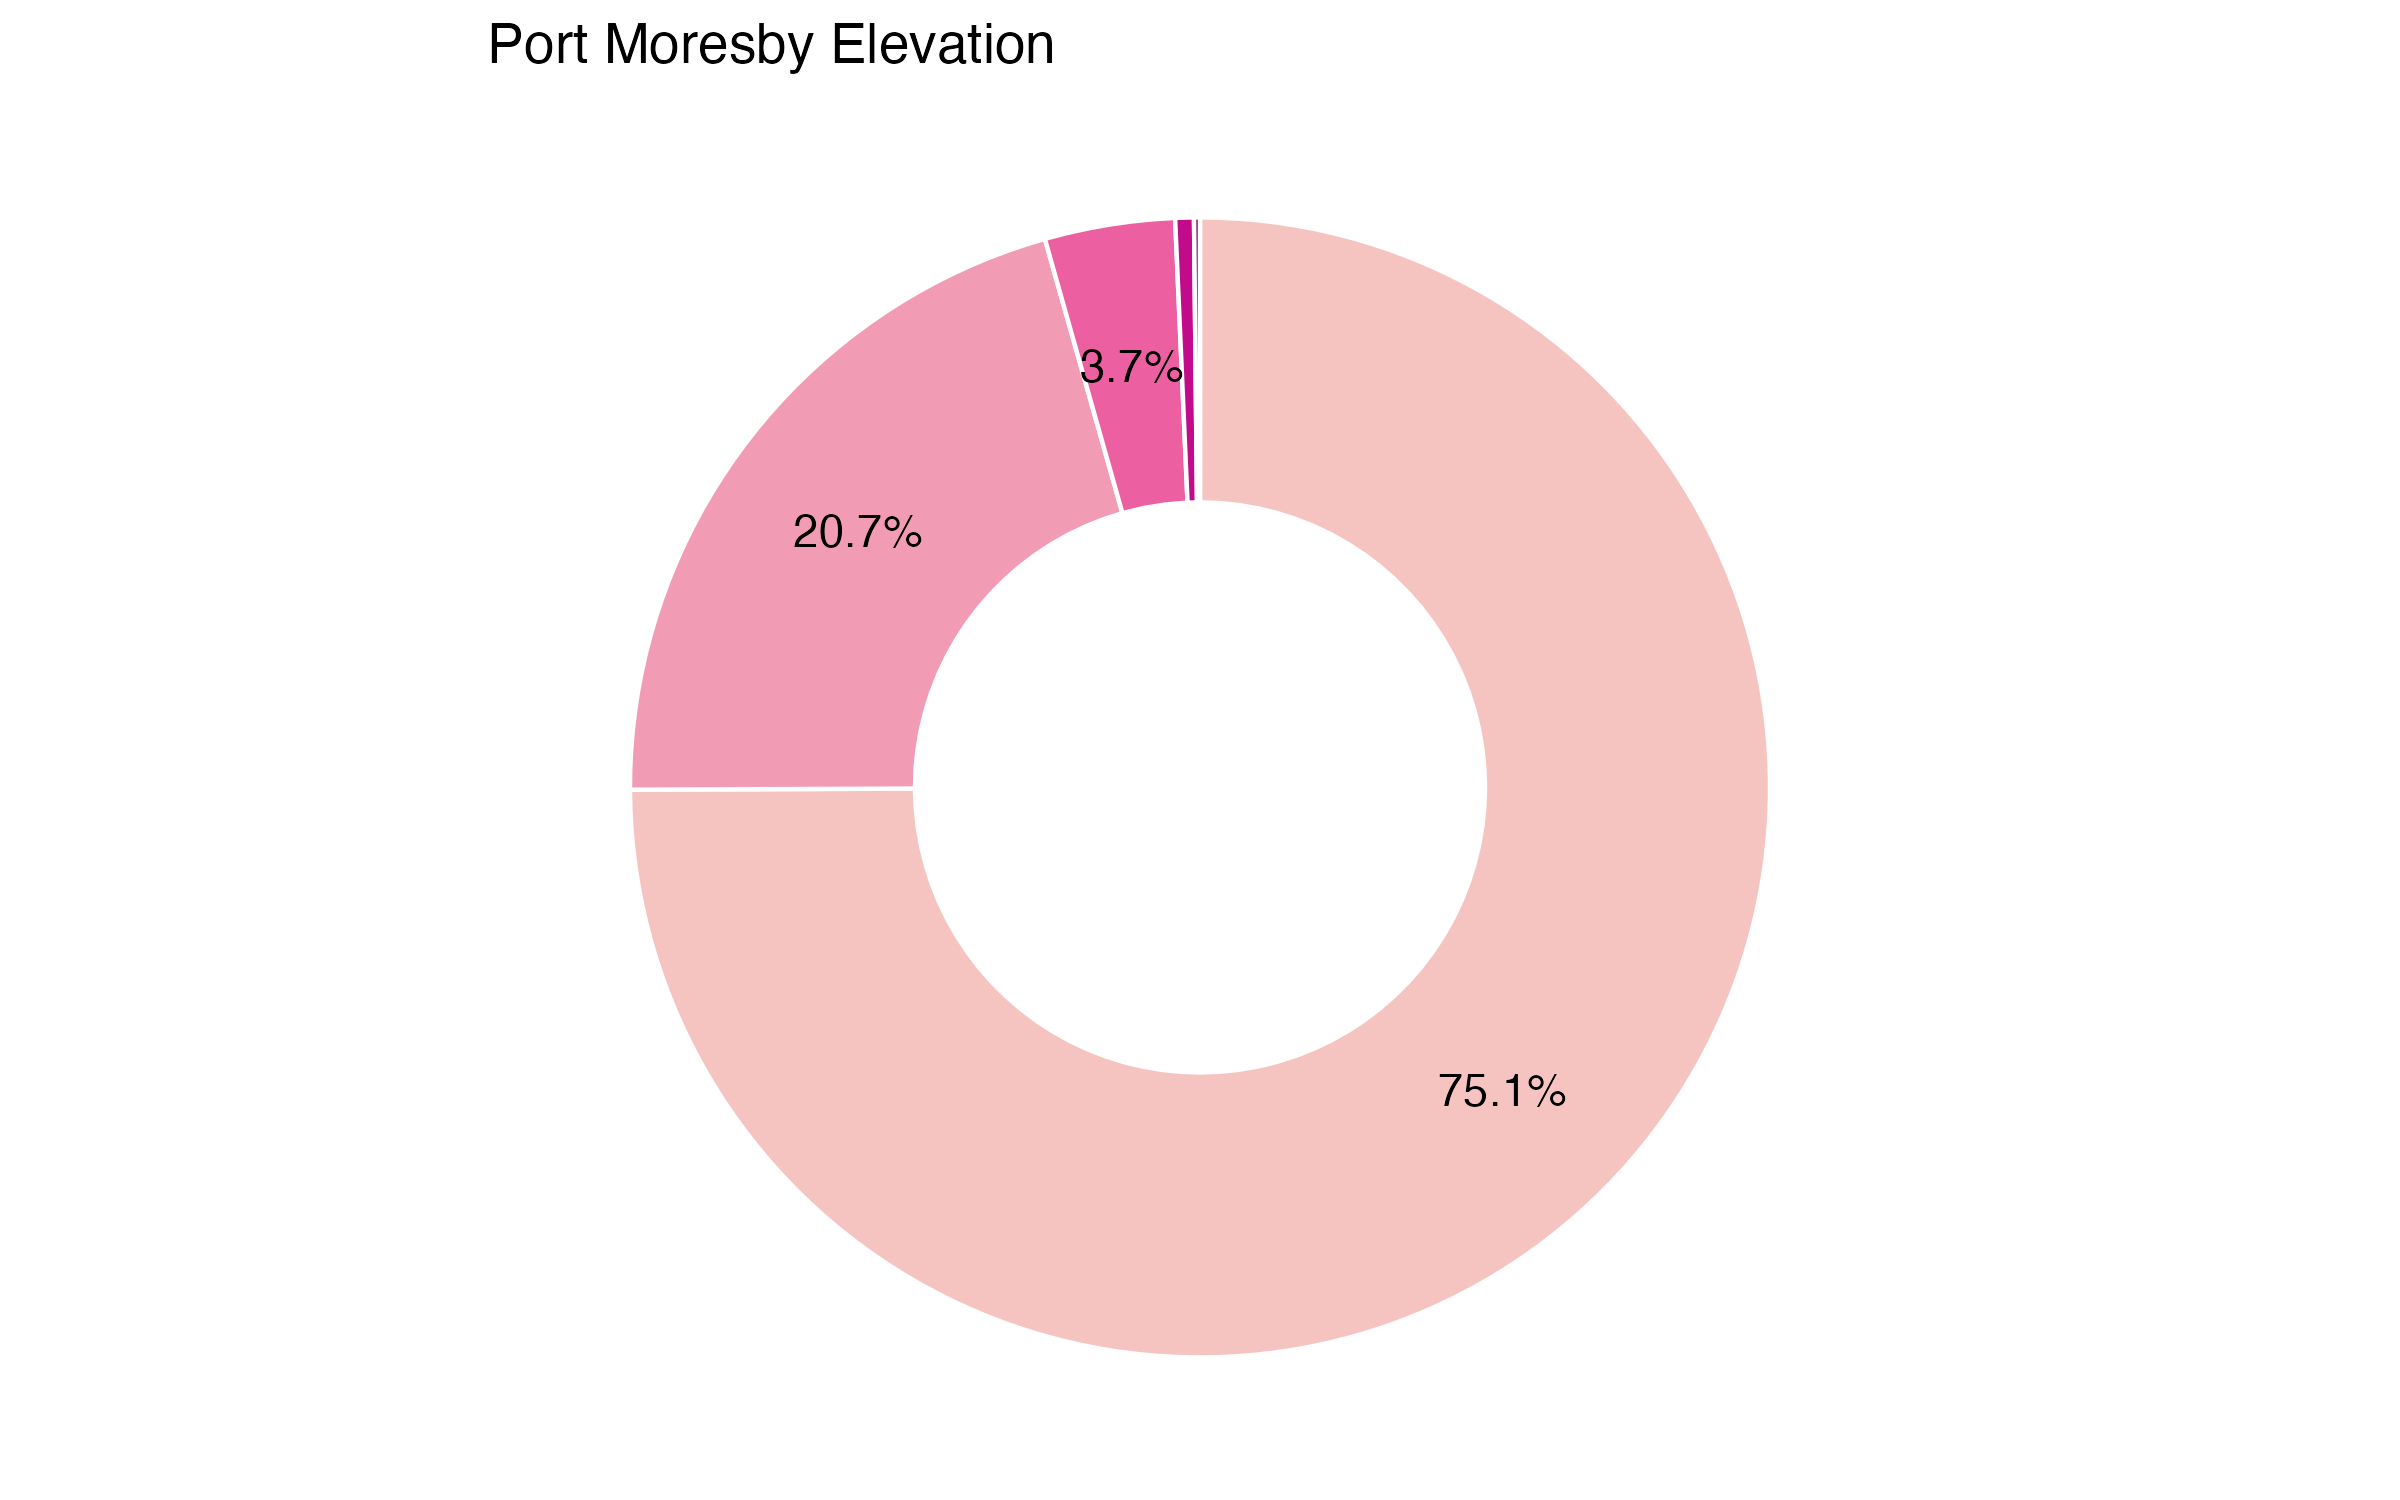
- The terrain of Port Moresby is characterized by ridges running from the northwest to the southeast
- Many of the hills are situated along the coastline, providing some defense against potential flooding
- The highest point of the city reaches 375 meters above sea level
Elevation informs an area’s vulnerability to many natural disasters. The height at which infrastructure, resources, and communities sit relative to normal water levels and tides, flood waters, and storm surges and waves informs their exposure. Elevation information is critical for communities to anticipate the impacts of disasters and to prepare resilient and cost-effective response and redevelopment strategies.
Map data from FABDEM V1-2.
Slope
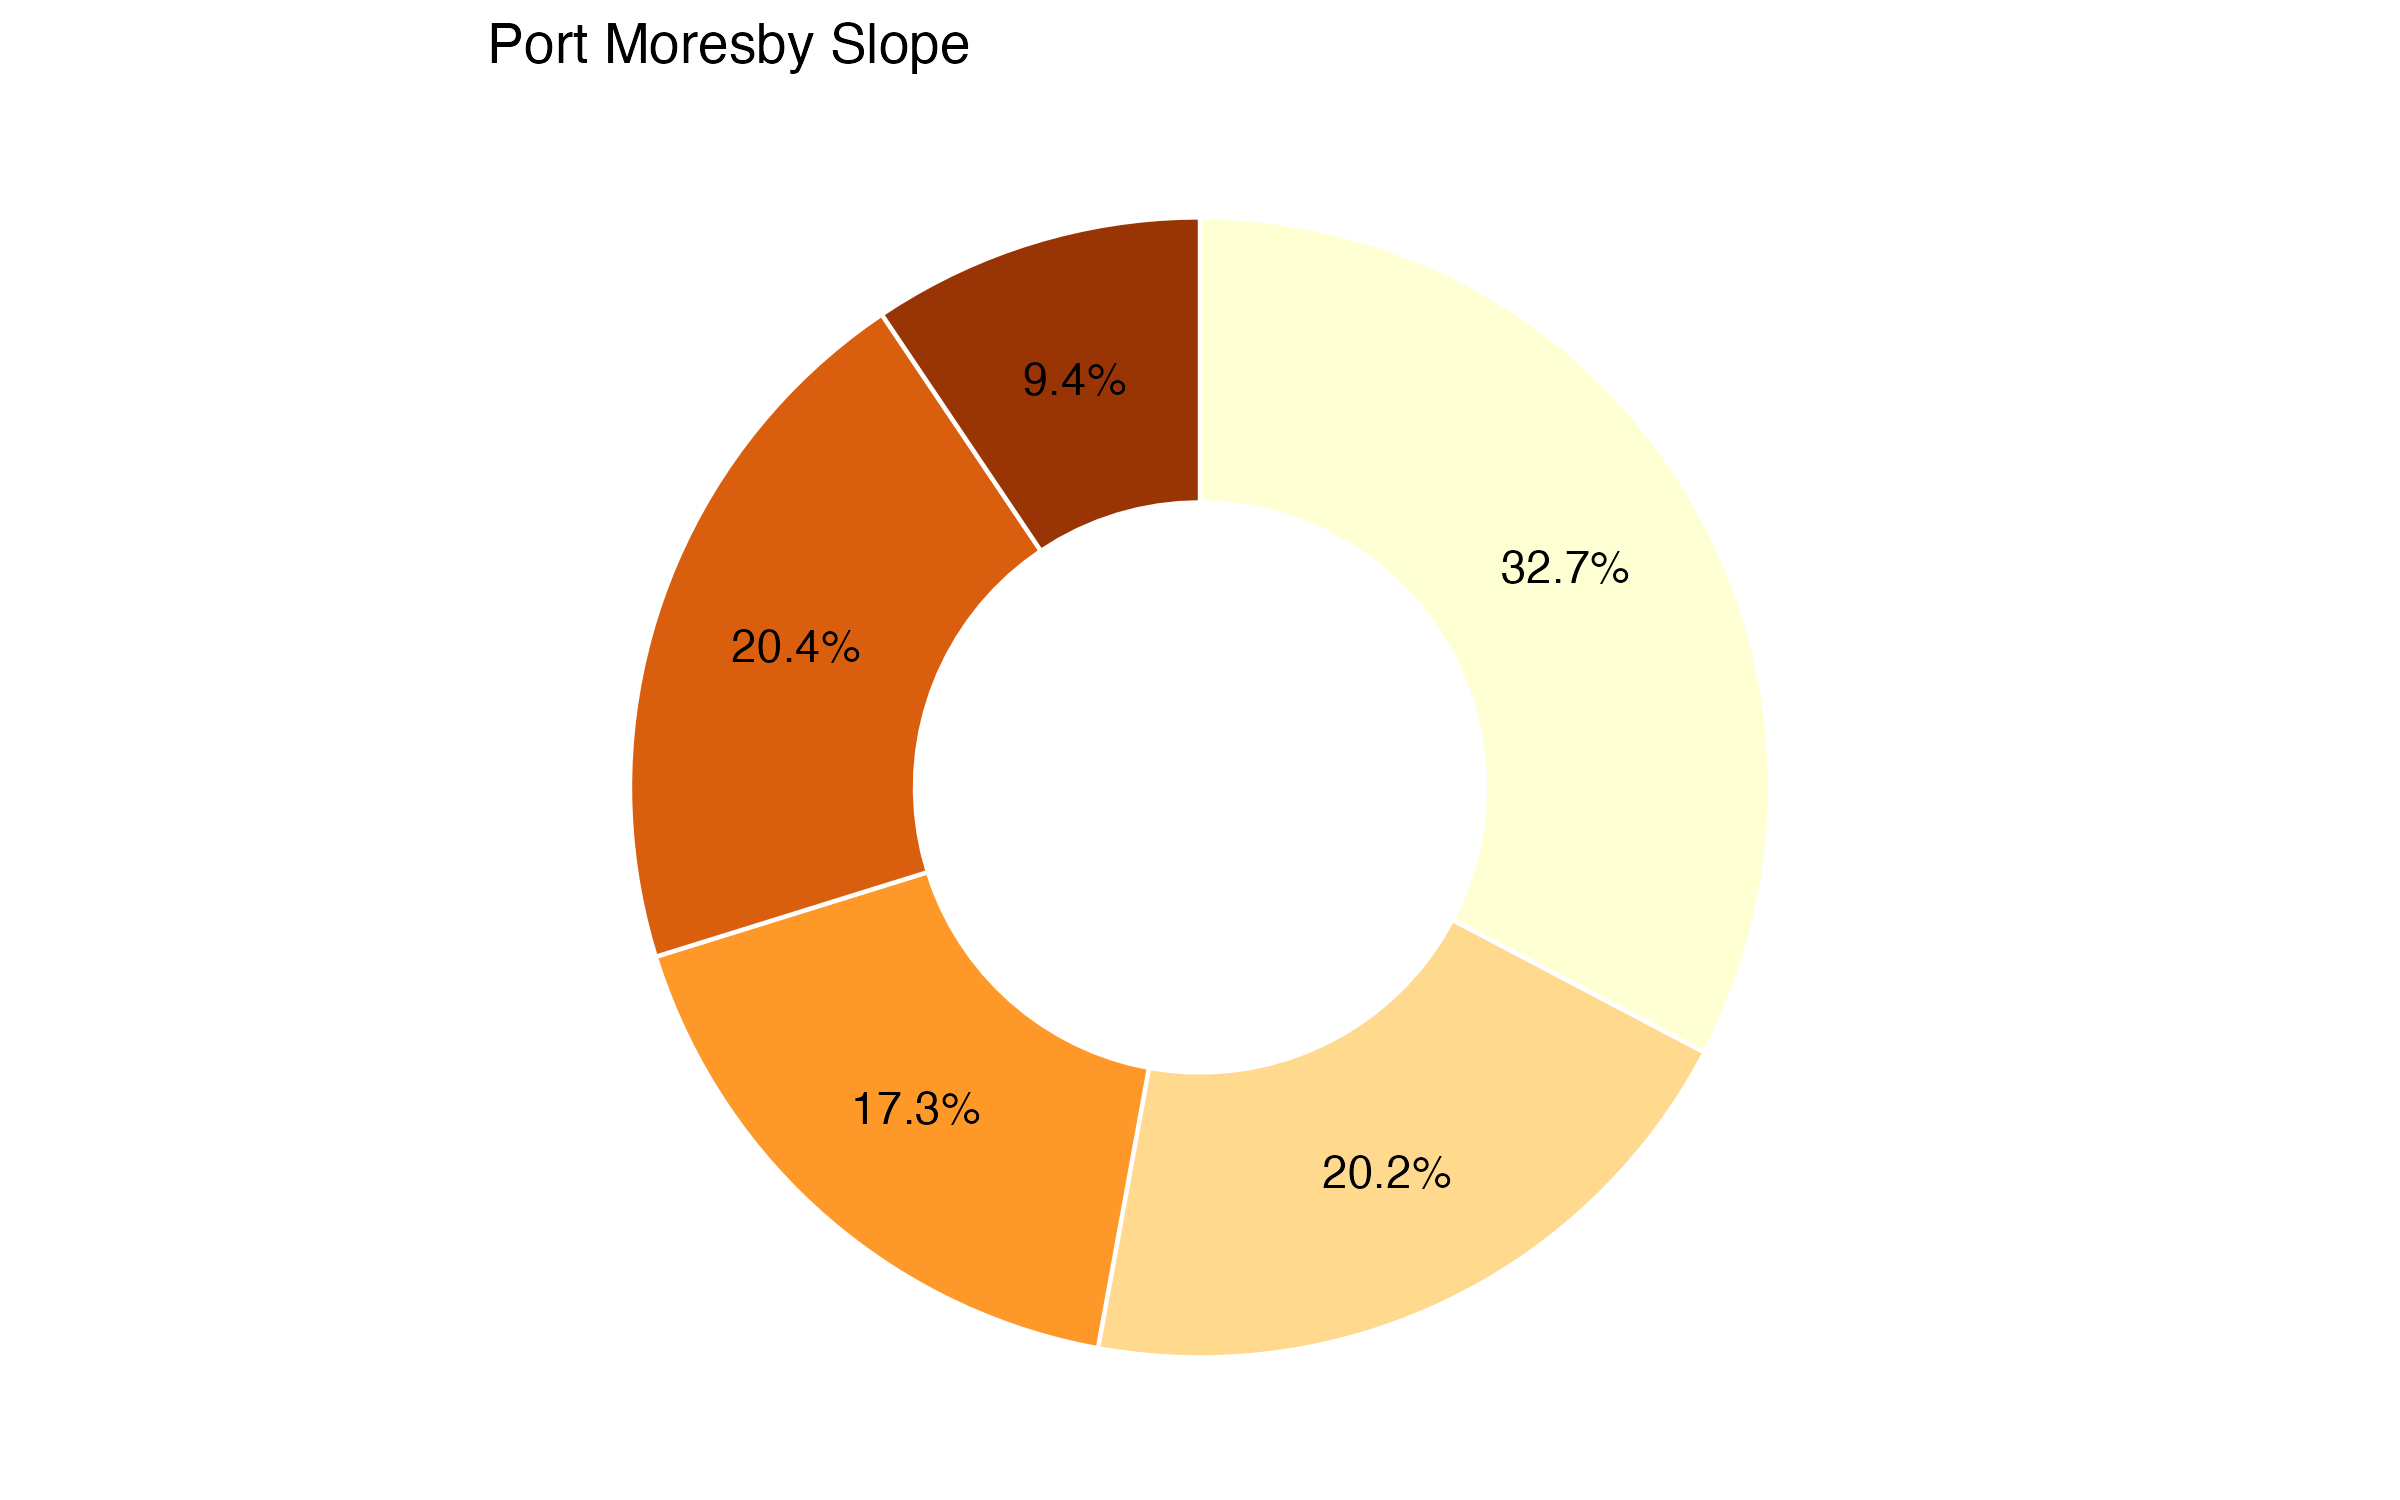
- A third of the city is relatively flat with a grade of less than 2° (3 5% grade) The steep areas are found among the hill range along the coastline, where the slope reaches over 20° (>36% grade)
Slope refers to the percentage change in elevation over a certain distance. In hilly or mountainous areas, floods can occur within minutes after heavy rains, while in flat areas, floodwaters can remain for days. Considering the slope of land is important in reducing construction costs, extending services and public facilities, minimizing the risks of hazards like flooding and landslides, and mitigating the impacts of development on natural resources.
Map data from USGS, 2015, “USGS EROS Archive - Digital Elevation”.
Landslides
- Landslide susceptibility ranges from low to medium in Port Moresby
- The city center faces higher landslide susceptibility than the less populated areas
- Earthquake-triggered landslides can be particularly serious in Port Moresby: a 2018 earthquake and the ensuing mudslide caused almost 50 casualties and severe economic damages
This indicator refers to the likelihood that a landslide will occur in a particular area based on local terrain conditions. It shows the degree to which a terrain can be affected by slope movements, i.e., an estimate of “where” landslides are likely to occur. Susceptibility does not, however, consider the temporal probability of failure (i.e., when or how frequently landslides occur), nor the magnitude of the expected landslide (i.e., how large or destructive the failure will be).
This map combines satellite observations of rainfall with an assessment of the underlying susceptibility of the terrain. Steep slopes are the most important factor in a landscape’s susceptibility to landslides. Others include deforestation, presence of roads, strength of the bedrock and soils, and location of fault lines.
Map data from NASA, “Landslide Susceptibility Map”.
Liquefaction
While all of the city has the same likelihood of seismic activity, areas within a city will typically have differing levels of vulnerability, due to factors such as soil and building construction. Liquefaction is a phenomenon where loosely packed or waterlogged sediments, particularly beneath buildings and under structures, lose their strength in response to strong ground shaking. Liquefaction in the event of an earthquake can cause increased damages.
This map calculates the likelihood of liquefaction using a combination of indicators such as peak ground velocity, precipitation and others. Each level determines a threshold of confidence regarding the probability of liquefaction in the particular pixel area.
Map data from Zorn & Koks, 2019.
Burnable Area
This layer visualizes the burnability factor of each land cover classification, based on assigning a binned weighting factor to represent burnability of each land classification. As per Four Twenty Seven’s research and Gannon and Steinberg’s (2021) research, global trends in historical wildfire intensity and occurrence of wildfire in each land cover classification is converted into a single burnability factor.
© ESA Land Cover CCI 2020/ Gannon et.al 2021
Historical Burnt Area
Historical fire is a kernel density plot of where there have been fires, as observed by satellite data, in recent years. The map is relative to the local area: areas with the highest density of fire are are not necessarily areas of lots of fires in absolute terms.
The Fire Weather Index (FWI) measures the potential for wildfire in an area at a given time, by combining measures of moisture, of built-up area, and of ignition spread. Areas with a higher index have a higher potential for wildfire, though the specific relationship between FWI and fire danger is highly localized; therefore values representing high fire potential must be determined locally.
Map data from Zorn & Koks, 2019. Graph data from NASA’s Global Fire Weather Database.
Local Institutions & Planning
Administrative Structure
- Under the national government, there are 22 provinces, the NCD area of Port Moresby, the autonomous region of Bougainville and 89 districts;
- Port Moresby is governed by the National Capital District Commission (NCDC), which is responsible for the overall administration and development of the city;
- The Governor is the executive head of the NCDC;
- The Department of Provincial and Local Government Affairs (DPLGA) has ministerial oversight on all matters relating to local government. This includes overseeing locally generated taxes, approving budgets, and ensuring proper reporting procedures are followed;
- Under the NCDC, there are 3 urban LLGs: Moresby North-West, Moresby North-East and Moresby South.
Availability Of Development Plans And Policies
- PNG’s long-term development strategy is guided by the PNG Vision 2050(2010-2050);
- PNG has established a legal and institutional framework for urban planning, which includes national, provincial and local level plans;
- “Port Moresby Towards 2030” is currently in development, and will serve as the Urban Development Plan for the city;
- At the local level, LLGs are responsible for preparing 5-Year Development Plans for their respective jurisdictions;
- Despite these efforts, spatial planning in PNG, and Port Moresby, specifically, faces several challenges. These include weak institutional capacity, insufficient funding, a lack of regulatory authority and limited participatory planning processes.
The State of Urban Infrastructure and Service Delivery
Land Administration
Land administration in Papua New Guinea (PNG) involves the management of land rights and ownership, integrating customary and statutory land tenure systems. Customary land, collectively owned by communities, coexists alongside statutory land, encompassing state, leasehold, and freehold land. The Department of Lands and Physical Planning holds the responsibility for overseeing land administration, including the registration of statutory land. However, this process faces challenges such as limited institutional capacity, inadequate resources, and land disputes. Addressing these challenges necessitates initiatives aimed at enhancing capacity, improving land registration systems, and fostering collaboration among stakeholders for sustainable and equitable land management. Despite the obstacles, there are ongoing reforms to strengthen land administration, clarify land boundaries, and increase the involvement of customary landowners in decision-making processes. These efforts aim to establish a more transparent and efficient land management system in PNG.
Housing
The housing sector in Port Moresby faces several challenges, primarily driven by the high demand for affordable housing and a limited supply of quality homes. The scarcity of available land, exacerbated by rapid population growth, has led to exorbitant accommodation costs and the proliferation of urban slums. As of 2018, it was estimated that approximately one million residents resided in informal settlements in Port Moresby. In addition to land scarcity, complex land acquisition procedures, inadequate financing options, insufficient infrastructure, escalating building material costs, and the absence of a cohesive, long-term housing vision pose further obstacles for both public and private sector housing initiatives. Around 60% of the land in Port Moresby is owned by the state, while the majority is under customary ownership. To address the needs of the growing urban population, the government aims to increase the supply of affordable housing and decrease the proportion of those residing in informal settlements from 28% in 2010 to 15% by 2030.
Energy
The energy sector in Port Moresby relies predominantly on hydroelectric power generated by the Rouna Hydro Power Station, operated by PNG Power Limited, the state-owned electricity company. Despite efforts to enhance energy access, certain areas in Port Moresby still grapple with limited availability of reliable and affordable electricity. Consequently, some communities, particularly those residing in informal settlements, resort to alternative sources like diesel generators and solar power systems. Recognizing the potential of renewable energy, initiatives to explore and develop projects in solar and biomass have been undertaken to diversify the energy mix and reduce dependence on fossil fuels. Nevertheless, the energy sector in Port Moresby continues to face various challenges. Limited infrastructure, inadequate investment, and concerns regarding affordability contribute to power outages and disruptions in the energy supply. While PNG has significant untapped energy resources, the development of these resources has been slow and the country’s electricity access remains remarkably low. It is estimated that only about 13 percent of PNG’s population have access to grid-connected electricity.
Disaster Risk Management
Disaster risk management in PNG is a critical undertaking due to the country’s geographical location and exposure to various natural hazards. PNG has established a National Disaster Risk Reduction Framework (NDRRF) 2017–2030 and a Disaster Management Act to provide a legal and policy framework for coordinating disaster response, preparedness, mitigation, and recovery efforts. The National Disaster Center (NDC) plays a central role in managing and coordinating disaster risk reduction and emergency response activities, working under the Department of Provincial & Local Level Government Affairs. In times of disasters, PNG mobilizes resources and implements response and recovery measures, including emergency relief, medical assistance, shelter, and infrastructure rebuilding. The country actively participates in regional and international partnerships to enhance its disaster risk management capabilities, collaborating with organizations such as the United Nations and neighboring countries.
Drinking Water Supply
The drinking water supply in Port Moresby is primarily sourced from the Sirinumu Dam, which collects water from the Laloki River and undergoes treatment processes to ensure its safety and quality. Despite notable improvements to the system, challenges persist in providing widespread access to safe drinking water across the city. According to a 2017 Joint Monitoring Program global baseline report, only 37% of PNG has access to basic water supply, and 19% to basic sanitation. In Port Moresby specifically, the cost of drinking water is prohibitively high, with the average price of 50 liters of water from a delivery service being £1.84, equivalent to half of a typical daily salary. To address these issues, the government, in collaboration with development organizations, is actively working to expand water infrastructure, enhance treatment processes, and increase access to safe drinking water, particularly in informal settlements. These initiatives aim to alleviate the burden of unaffordable and unreliable water sources, ensuring that all residents of in the city have access to clean and affordable drinking water.
Urban Roads & Transport
The provision of safe and reliable road and transport infrastructure is critical to meet the needs of Port Moresby’s growing population. However, the quality of roads vary considerably across the city. Major roads and thoroughfares are generally well maintained, while secondary roads often lack proper upkeep. Public transportation primarily consists of buses and taxis, but these services typically fall short in terms of quality. Issues such as affordability, overcrowding, inadequate maintenance, and safety concerns are commonly experienced. In 2022, after a decade of planning, the National Capital District Commission launched the Eda City Bus Service, which now operates eight routes across the National Capital District (NCD), including Port Moresby. Furthermore, the local government is currently engaged in endeavors to transition towards a low-emission transport sector by formulating a sustainable urban transport mobility plan. This plan will serve as a roadmap for future development, focusing on implementing sustainable urban mobility approaches in Port Moresby.
Solid Waste Management
Solid waste management is a critical environmental challenge facing cities throughout PNG. With rapid urban growth, the existing waste management infrastructure in Port Moresby proves inadequate to meet the demands of this expanding city. Consequently, issues such as littering, illegal dumping, and burning have become widespread, particularly in informal settlements, posing significant environmental and health hazards. Although precise data on the quantity and composition of municipal solid waste is not readily available, it is estimated that Port Moresby produces approximately 135 tons of household solid waste daily. Moreover, the primary waste dumpsite, known as Baruni, is considered hazardous due to the widespread practice of disposing waste in unlined landfills. This improper disposal method leads to groundwater contamination and pollution of nearby water sources. Additionally, there is limited awareness among residents regarding environmental issues associated with waste, recycling, and sustainable waste management practices.
Local Administration
PNG operates as a federal constitutional monarchy, comprising three levels of government: national, provincial, and local. At the local level, representation is provided by local-level governments (LLGs), which consist of 31 urban LLGs and 265 rural LLGs across the country. The president, serving as the head of the LLG, is directly elected by the electorate every five years in both urban and rural LLGs. In terms of financial support, LLGs heavily rely on the national government for both recurrent and development budgets. While a few urban LLGs generate revenue through the collection of fees and rates associated with community services, the majority of LLGs depend on funding from the national government. The provision of public services is predominantly the responsibility of the national government, with support from provincial authorities. However, local governments have specific duties,including road and park development, refuse collection and disposal, health and environmental protection, economic promotion and tourism, as well as water supply management.
Land Administration: PNG National Research Institute, 2021. Housing: Oxford Business Group, 2020. Energy: The World Bank, 2021. Disaster Risk Management: UNDP, n.d.; UNDRR, 2019. Water: Unicef, 2021; Kweifio-Okai, Carla. 2016; Asian Development Bank, 2016. Roads and Transport: Asian Development Bank, 2023. Solid Waste Management: Asian Development Bank, 2014.
Local Administration: Clgf, n.d.
Key Considerations for Investment Planning & Prioritization
Concluding Questions
What is the most surprising result for you in this City Scan?
What patterns did this City Scan illuminate that you had not considered before?
What are your city’s critical development challenges?
What other information would you like in order to corroborate or amplify the information in this City Scan?
Who else would you like to speak with to gain further understanding about your city’s development challenges?
What investments need to be prioritized? What trade-offs are inherent in your prioritization?
What investments could be coordinated? What benefits would such coordination bring?