Majuro, Marshall Islands
Majuro, Marshall Islands
City Scan
May 2025
![]()
![]()
![]()
![]()
Executive Summary
Setting the Context
Majuro is the capital and largest city of the Republic of the Marshall Islands. It is a large coral atoll of 64 islets in the Pacific Ocean. The atoll has a land area of 9.7 km2 and encloses a lagoon of 295 km2. Located in the east atoll, Majuro’s main population center is Delap-Uliga-Djarrit. Majuro’s economy is primarily dominated by the service sector, which composed 86% of Marshal Island’s GDP in 2011. Majuro is the national economic hub and has a port, a central shopping district, hotels, and an international airport.
Population and Demographic Trends
Majuro’s population grew at an average annual rate of 1.8% from 1988 to 1999 and 1.4% from 1999 to 2011. Majuro is the most populated atoll in the Republic of the Marshall Islands. Compared to a benchmark group of regional islands and atolls, Majuro’s 2011 population density of 2,866 persons per km2 is the highest. Majuro’s population is densest in a small hotspot in the extreme west, in the town of Laura, and the hotspots in the east, at 90-100 persons per 100 square meters, in Delap-Uliga-Djarrit city, in the Djarritt, Uliga, and Rairikku districts.
City Competitiveness and Economic Activity
As indicated by a higher intensity of nighttime light emissions, economic activity in Majuro appears to be concentrated in the east, in a small hotspot in Delap-Uliga-Djarrit, in the Uliga district. The most significant increases in economic activity in Majuro since 2013, indicated by a higher average radiance of nighttime lights, appear most prominently in small zones in Delap-Uliga-Djarrit, in the Rairikku district, and slightly in Laura. Areas showing low or negative slopes of change in nighttime light radiance appear throughout the city’s outer regions.
Built Form
Over time, Majuro’s built-up area expanded in Delap-Uliga-Djarrit, with growth filling gaps in the city’s historic built-up area. The city’s built-up area grew at an average rate of 5.2% between 1975 and 2014, with the highest growth taking place between 1990- 2014. The highest levels of imperviousness in Majuro are found mainly in Delap-Ulija-Djarrit in the Uliga and Djarrit districts. The predominant land cover classes of Majuro are water bodies (46%) and tree cover (22%), as well as grassland (8%). Only 11% of Majuro’s available land is built-up. Within Majuro, the road intersection density is highest in Laura and Delap-Uliga Djarrit.
Climate Conditions
The highest PV potential for Majuro is in the western zones in Laura and Rongrong. The concentration of PM2.5 throughout Majuro is not a concern, at under 2.5-5 µg/m3 throughout the city. Green spaces in Majuro appear prominent throughout the atoll, particularly in Laura and in hotspots in Delap-Uliga-Djarrit, particularly in the Uliga district and in Rairikku.
Risk Identification
With 1 m of sea-level rise, Djarrit would be almost entirely inundated, with significant parts of Uliga, Delap, and Rairok going underwater. With 2 m of sea-level rise, Majuro’s entire building stock, estimated at 5,808 buildings covering an area of 800,000 m2, is at risk of permanent inundation and high risk to coastal flooding. Without any form of adaptation, 37% of Majuro’s building stock is at risk of permanent inundation from a 1 m sea-level rise. Much of Majuro’s inhabited land lies between -2 - 2 meters in elevation (60%). The elevation rises to 2-5.5 meters, mainly in the atoll’s eastern zones. Majuro’s susceptibility to landslides is very low, given its low sloping area. In Majuro, the most critical road segments are found along Lagoon road.
Local Institutions and Planning
Majuro is the administrative center of the Republic of the Marshall Islands. The atoll consists of 64 islets and is governed by the Majuro Atoll Local Government (MALGOV), and acts under the Constitution of the Majuro Atoll Local Government. MALGOV is governed by an elected mayor and a fifteen-member council. The Republic of the Marshall Island’s National Strategic Plan (NSP) is the country’s overarching government planning and budgeting guide for 2020- 2030. The NSP highlights threats posed by climate change to every aspect of Marshallese lives and livelihoods and the need to build resilience and proposes immediate investment in coastal protection; climate-proofing critical infrastructure; food, water, and health security; and early warning systems and disaster risk reduction measures.Setting the Context
Basic City Information
Majuro is the capital and largest city of the Republic of the Marshall Islands. It is a large coral atoll of 64 islets in the Pacific Ocean. The atoll has a land area of 9.7 km2 and encloses a lagoon of 295 km2.
Located in the east atoll, Majuro’s main population center is Delap-Uliga-Djarritt. Majuro’s economy is primarily dominated by the service sector, which composed 86% of Marshal Island’s GDP in 2011. Majuro is the national economic hub and has a port, a central shopping district, hotels, and an international airport. Majuro’s economy is driven by the services sector, mainly from banking and insurance, professional services, public administration, restaurants, repair services, retail and wholesale trade, construction, copra processing, and fishing. Positioned slightly north of the Equator, Majuro has a tropical rainforest climate, with trade winds prevailing throughout the year.
The boundary lines mark the area of interest for the City Scan. These lines may differ from the city’s official administrative boundaries and may include multiple jurisdictions.
Population and Demographic Trends
Population Density
Majuro’s population is densest in a small hotspot in the extreme west, in the town of Laura, and in hotspots in the east, at 90-100 persons per 100 square meters, in Delap-Uliga-Djarrit city, in the Djarrit, Uliga and Rairikku districts.
This map estimates population numbers per 10,000 m2 grid cell. It provides a more consistent representation of population distributions across different landscapes than administrative unit counts. Knowing where people are is critical for impact assessments and intervention plans, especially those focused on service delivery, food security, climate change, network systems and natural disasters.
Population Growth
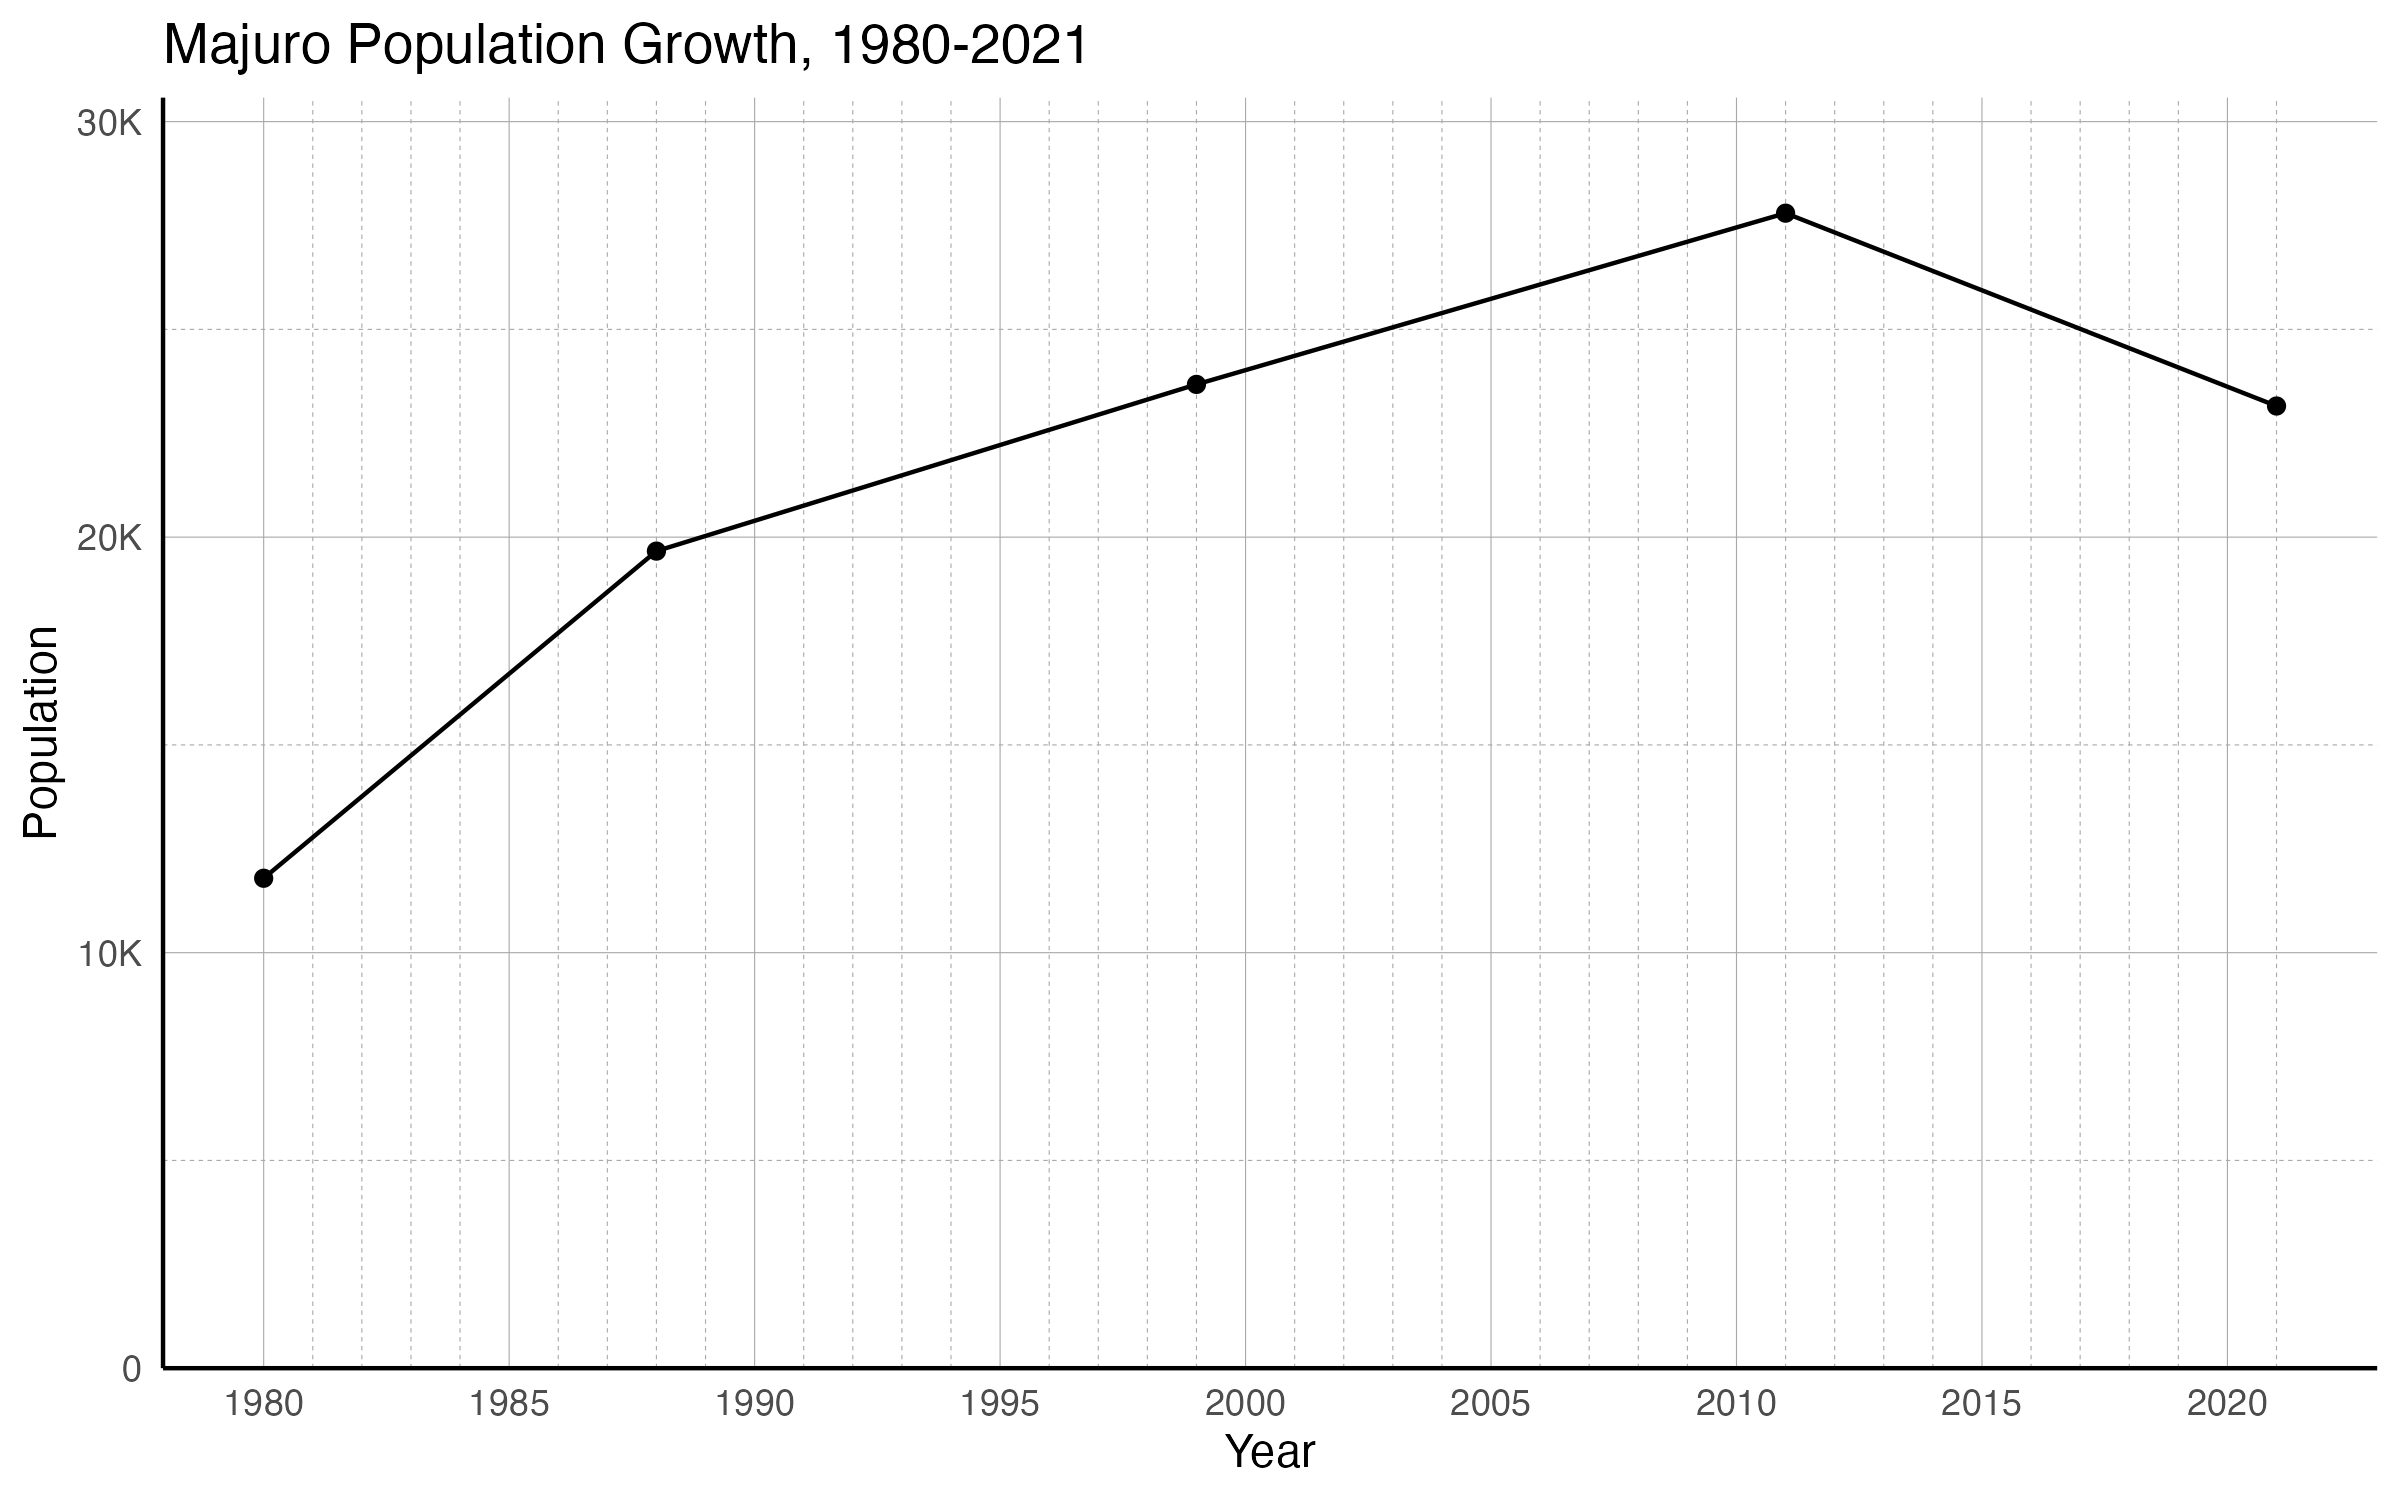
- Majuro’s population grew by 96.4% from 11,791 in 1980 to 23,156 in 2021 for an average annual growth rate of 1.7%
- The population declined from 27,797 in 2011 to 23,156 in 2021
Population figures are typically used as a denominator for many indicators, and are a measure of demand for services. The line chart above summarizes the city’s population change according to census and other public data. High growth of urban populations, caused by rates of natural increase (more births than deaths) in urban areas, migration from rural to urban areas, and the transformation of rural settlements into urban places, puts pressure on cities to meet the new demand.
Population Density
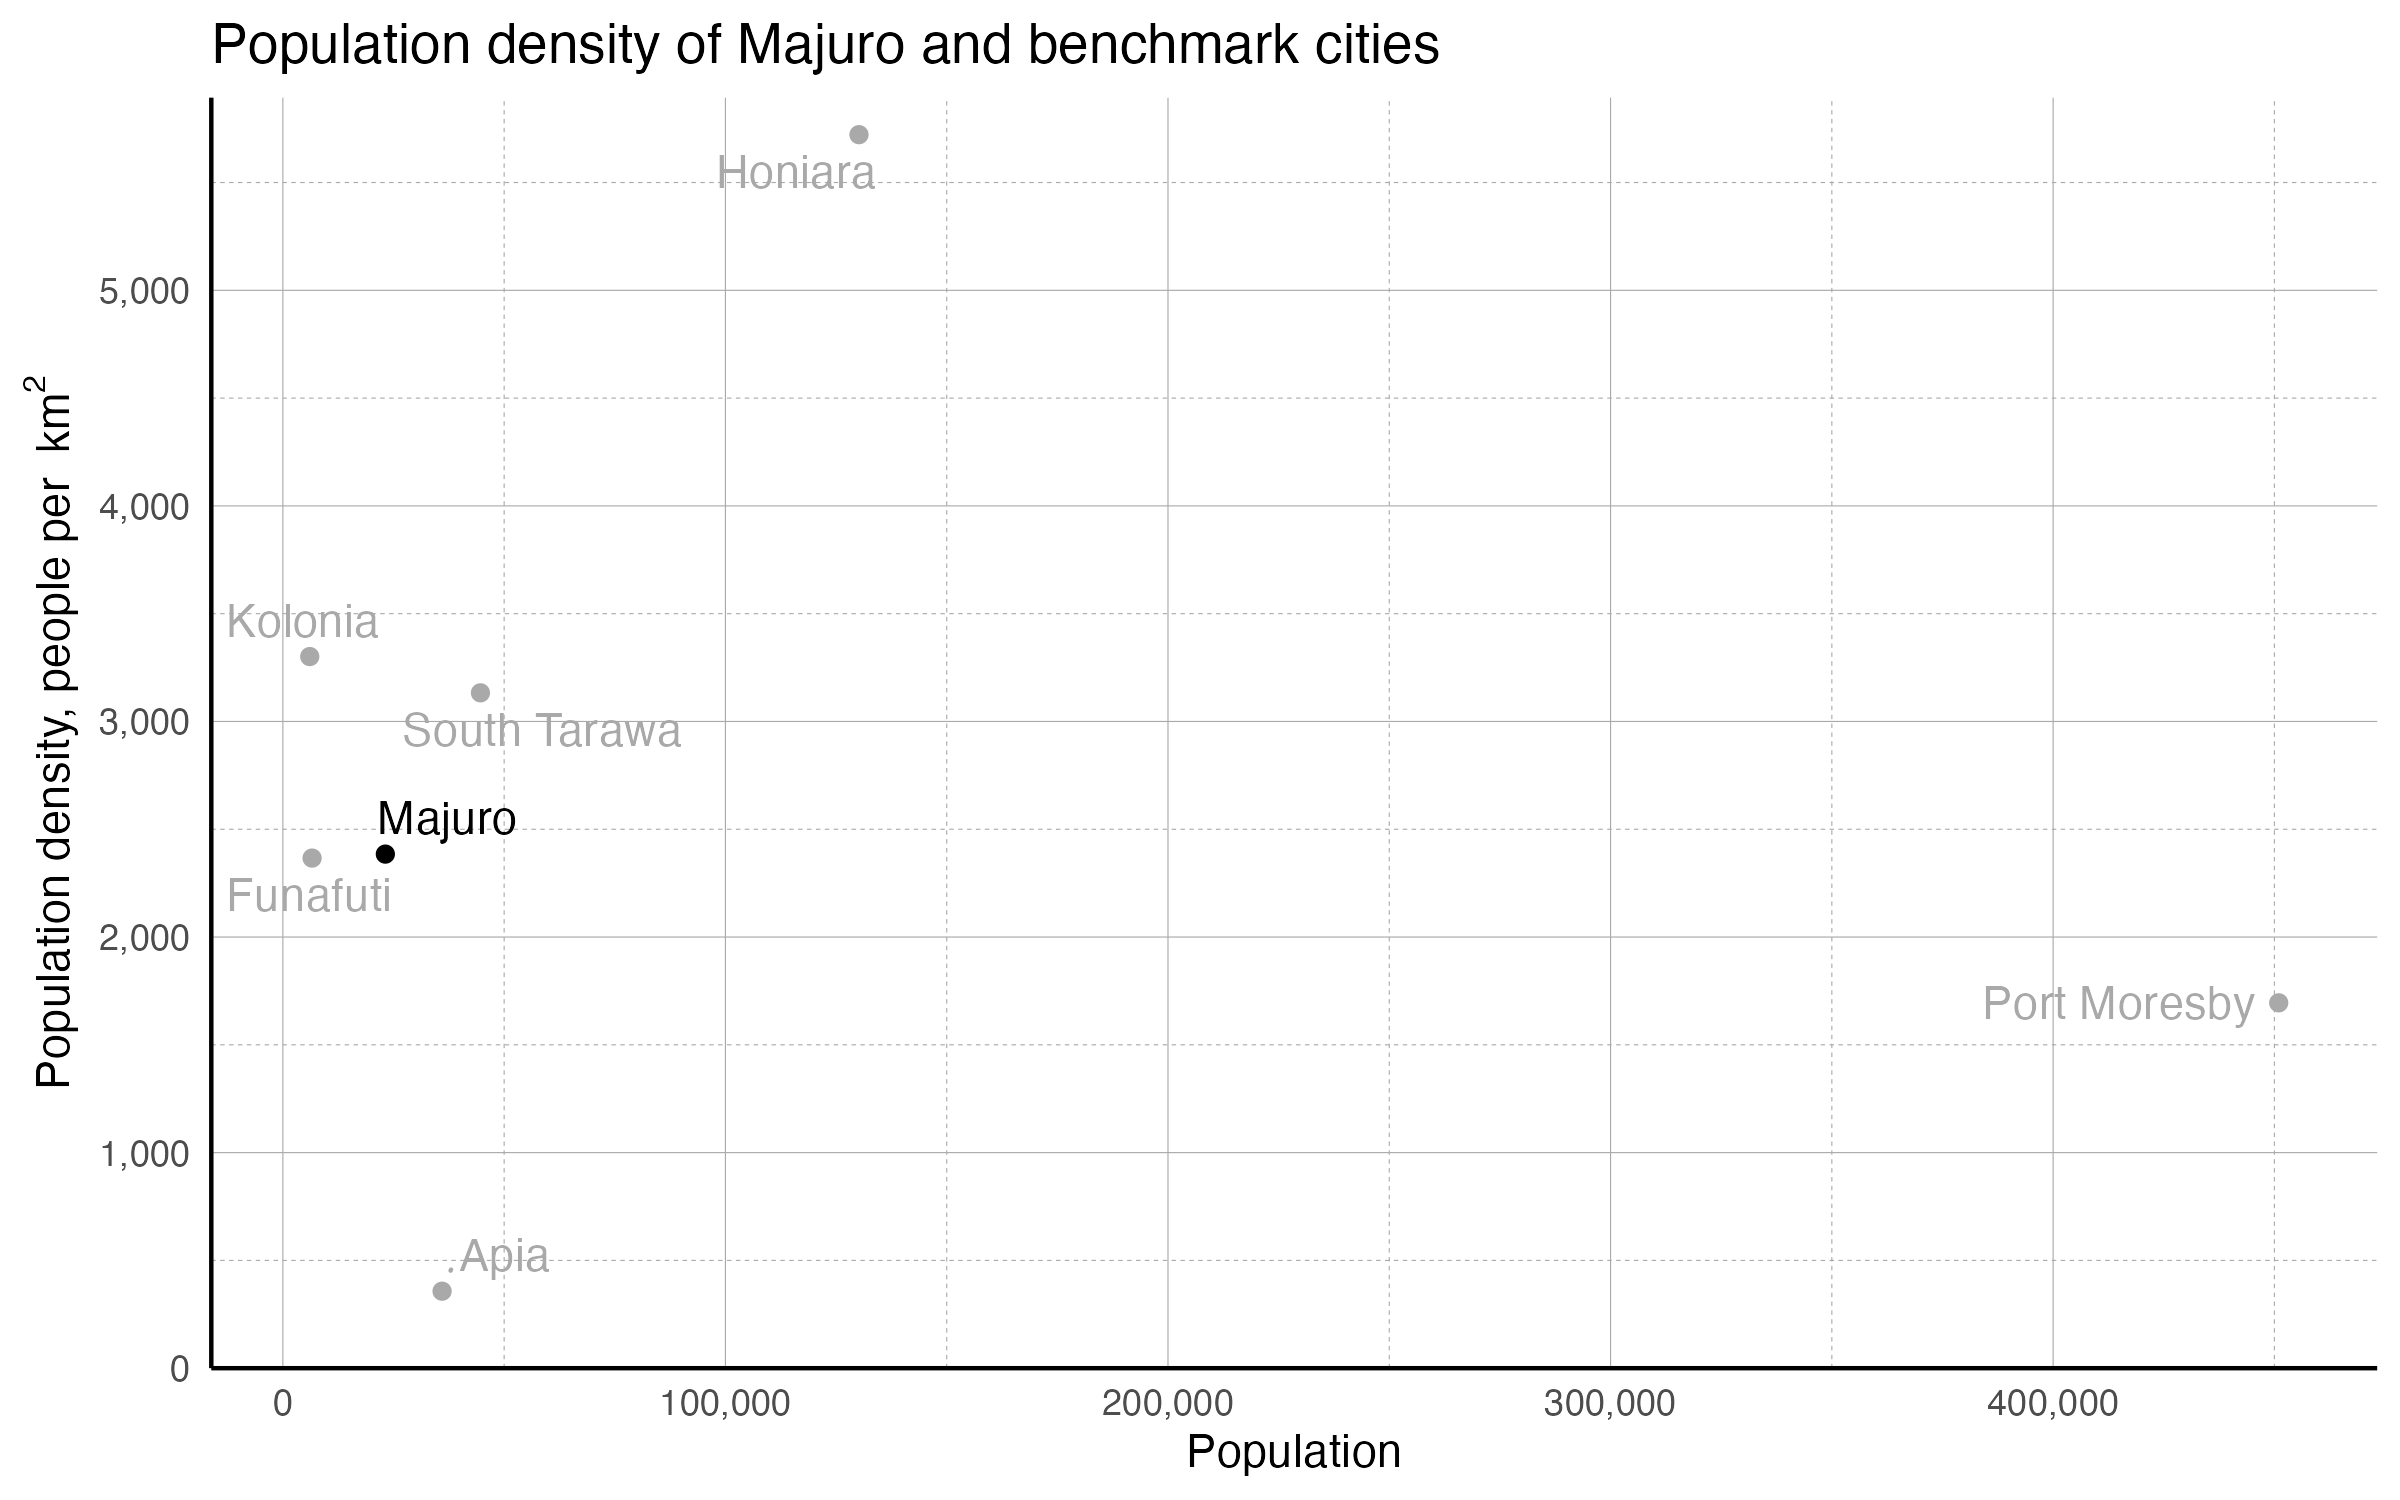
- With an area of 9.7 km2, Majuro has a population density of 2,386 people per km2
- This denisty is most similar to that of Funafuti, Tuvalu
Density is calculated using the most recent census population recorded and the official land area occupied by the city, and is an important measure of how cities function. Higher population density enables governments to more easily deliver essential infrastructure and services in urban areas at relatively low cost per capita. However, such benefits do not materialize automatically or inevitably. Whether a city’s population dynamics pose challenges or offer opportunities typically depends on the policies in play.
Populations and area are from Oxford, 2022, “Oxford Economics” or CityPopulation.de. Note that Oxford Economics uses quite large extents for its cities, meaning that the measured density is likely considerably lower than the density experienced by most inhabitants of the cities. Extents used by the both data sources may differ from the AOIs used by the City Scans.
Population Distribution by Age & Sex
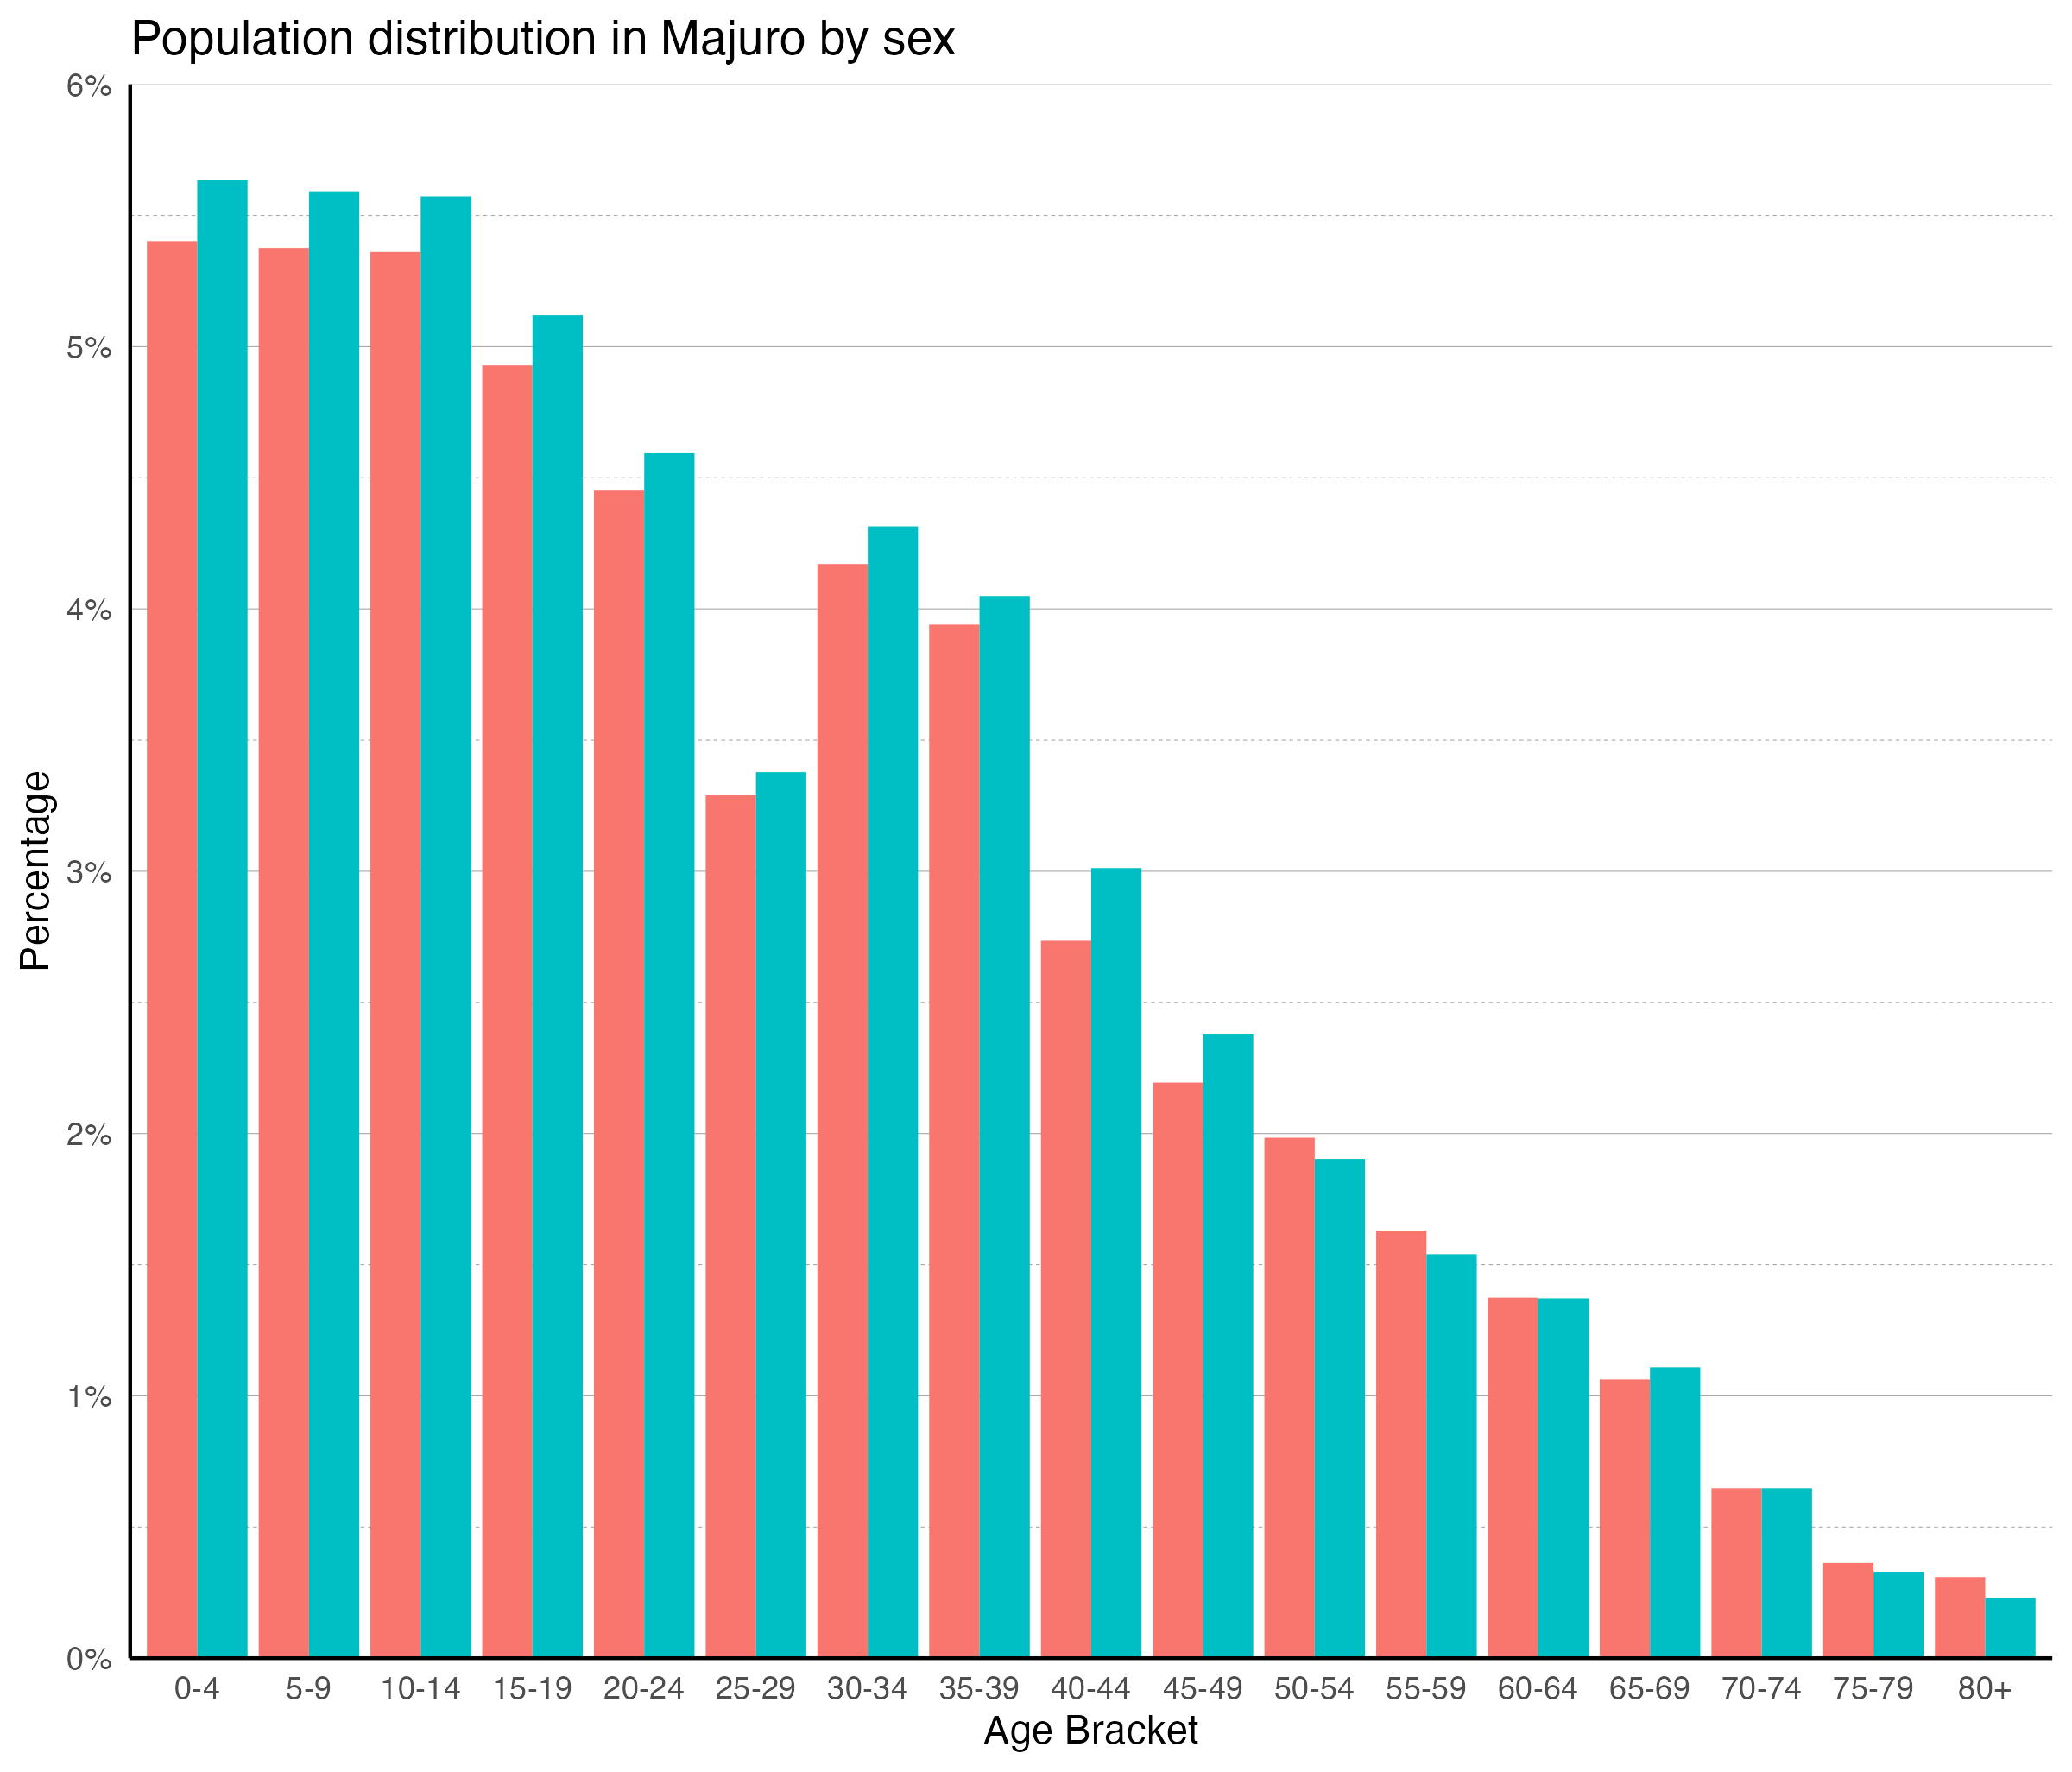
- Majuro has a fairly young population
- A third of the population is under 15 years old, and 80% is under 45 years old
- 62% of the population is of working age (15-64 years old)
- For every 100 females, there are 103 males
- 52% of females are of reproductive age (15-49 years old)
This column chart classifies the city’s population according to age group, forming the basis of population projections. Populations vary significantly in their proportions of young and old people, with growing populations generally appearing younger, and declining or slowly growing populations generally appearing older.
Data from WorldPop. Bondarenko, et al, Estimates of total number of people per grid square broken down by gender and age groupings for 51 countries across sub-Saharan Africa in 2020 using Ecopia.AI and Maxar Technologies building footprints, 2020.
Reproductive age is defined as 15–49. Working age is defined as 15–64.
Economic Activity
Economic Hotspots
- Economic activity appears to be concentrated in the east, in a small hotspot in Delap-Uliga-Djarrit, in the Uliga district
This map measures the total emissions of nighttime lights from the monthly average of radiance for 2014 through 2022. Nighttime light radiance is a common proxy for economic activity: where there is more artificial light, there is generally more commercial activity. VIIRS observations are made fairly late at night, as its satellites cross the equator at around 1:30 local time; thus, the observed lights are typically street lights and nights which are left lit all night long. The correlation of nighttime light and economic activity is strongest for urban areas; it is less relevant in agricultural areas and areas with very low population density.
Map data from NOAA, “VIIRS Daily Mosaic”.
Change in Economic Hotspots
The greatest increases in economic activity in Majuro since 2013, indicated by a higher average radiance of nighttime lights, appear most prominently in small zones in Delap-Uliga-Djarrit, in the Rairikku district, and appear slightly in Laura. Areas showing low or negative slopes of change in nighttime light radiance appear throughout the city’s outer regions.
The map illustrates monthly temporal changes from 2014 to 2022 in the emission of nighttime lights, indicating changes in economic activity. Positive values represent an increase in the intensity of nighttime light emission and, by proxy, economic activity, while negative values represent a decrease in the intensity of nighttime light emission, and economic activity.
Map data from NOAA, “VIIRS Daily Mosaic”.
Built Form
Intersection Density
Within Majuro, the road intersection density is highest in Laura and Delap-Uliga Djarrit.
Intersection density is a measure of network compactness, conveying information about street connectivity. The amount and types of intersections in a road network help determine how a local community functions and the character of the streets themselves. In a good street network, most streets should connect at both ends. A high level of connectivity provides an efficient platform for dispersing traffic, facilitating route choice, and creating more comfortable conditions for people who travel by foot, bike, or transit.
Map data from OpenStreetMap.
Land Cover
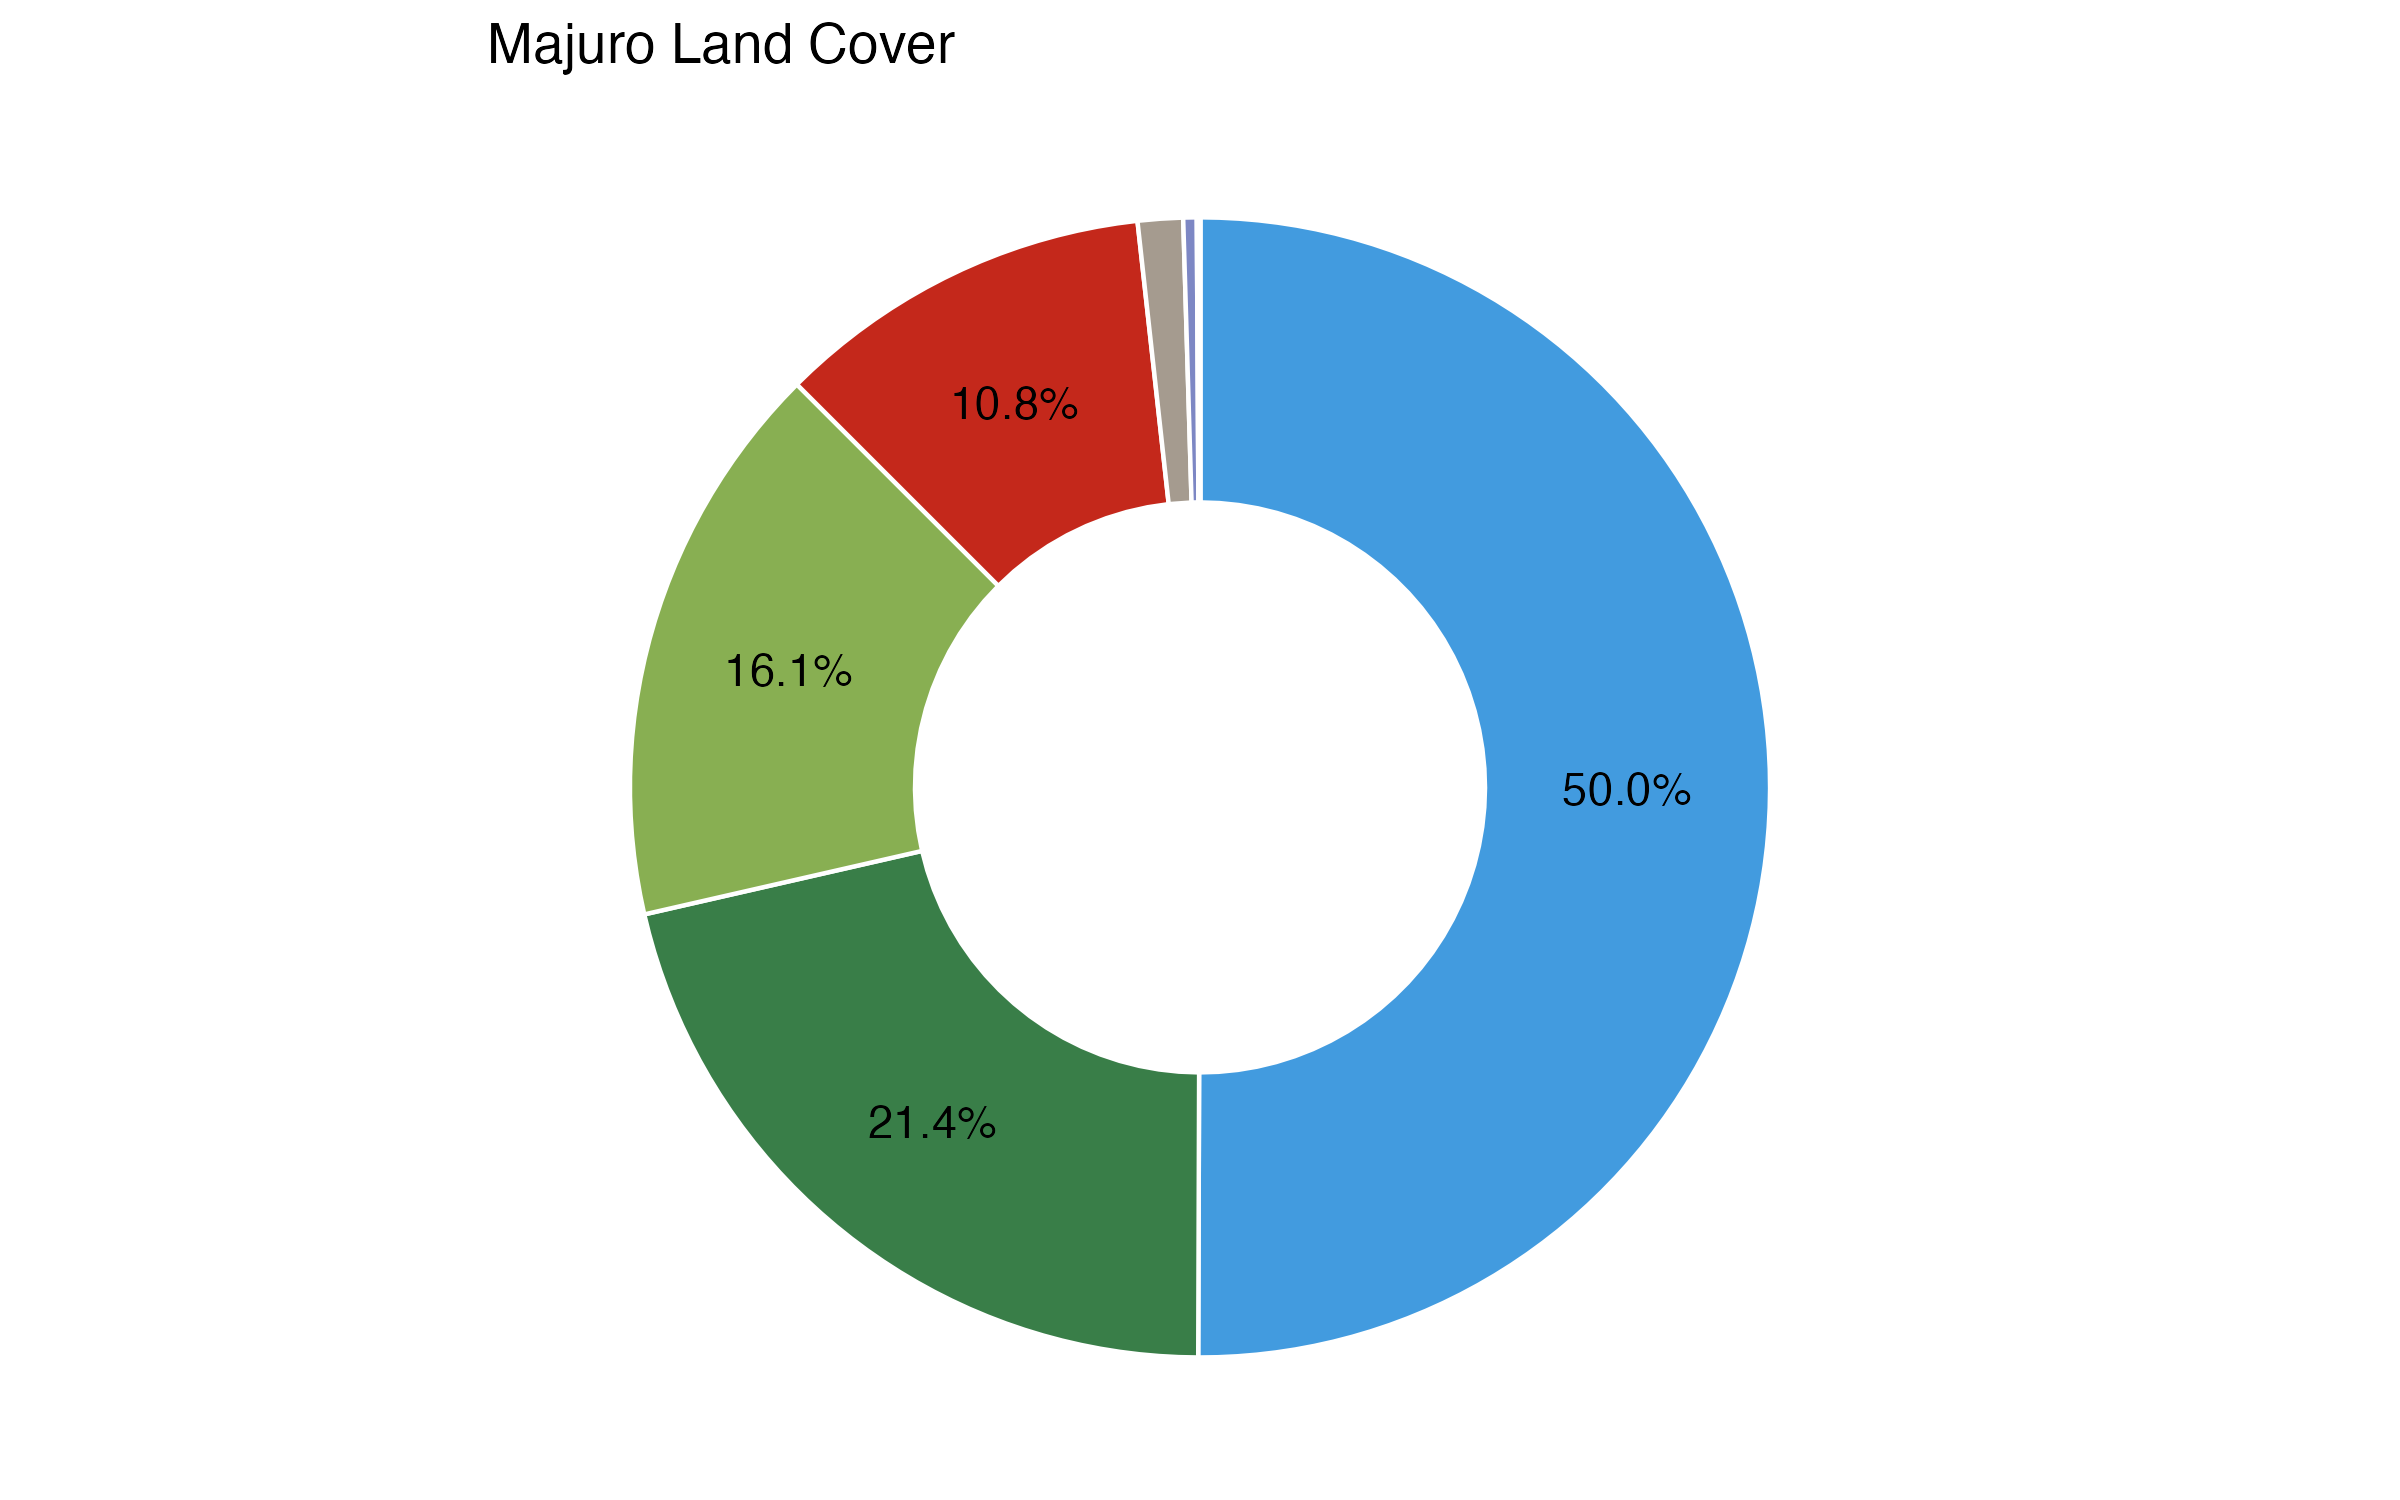
The predominant land cover classes of Majuro are water bodies (46%) and tree cover (22%), as well as grassland (8%). Only 11% of Majuro’s available land is built-up.
Land cover refers to the ground surface cover, including vegetation, urban infrastructure, water, and bare soil, among other classifications. Identifying land cover type helps to understand land utilization and inform planning policies and programs.
© ESA WorldCover project 2020 / Contains modified Copernicus Sentinel data (2020) processed by ESA WorldCover consortium’
Access to Schools
Most of Majuro’s built-up area in Laura and Delap-Uliga-Djarrit is located within a 2,400-meter journey along the city’s road network to a school.
Using a proximity analysis along the existing road network, this map identifies the areas that are most- and least-accessible to schools. The analysis includes all facilities classified in OpenStreetMap as a school, kindergarten, college or university. Note that there may be more schools that are not included in OpenStreetMap.
Map data from OpenStreetMap and DLR, 2015.
Access to Health Facilities
While hospitals are found in Majuro’s main population centers of Uliga and Laura, there are notable built-up areas all along Lagoon Rd. further than a 3,200-meter journey along the road network from a hospital.
Using a proximity analysis along the existing road network, this map identifies the areas that are most- and least-accessible to schools. The analysis includes all facilities classified in OpenStreetMap as a health amenity, clinic, or hospital. Note that there may be more health facilities that are not included in OpenStreetMap.
Map data from OpenStreetMap and DLR, 2015.
Climate Conditions
Solar Photovoltaic Potential
- The highest PV potential for Majuro is in the western zones in Laura and Rongrong.
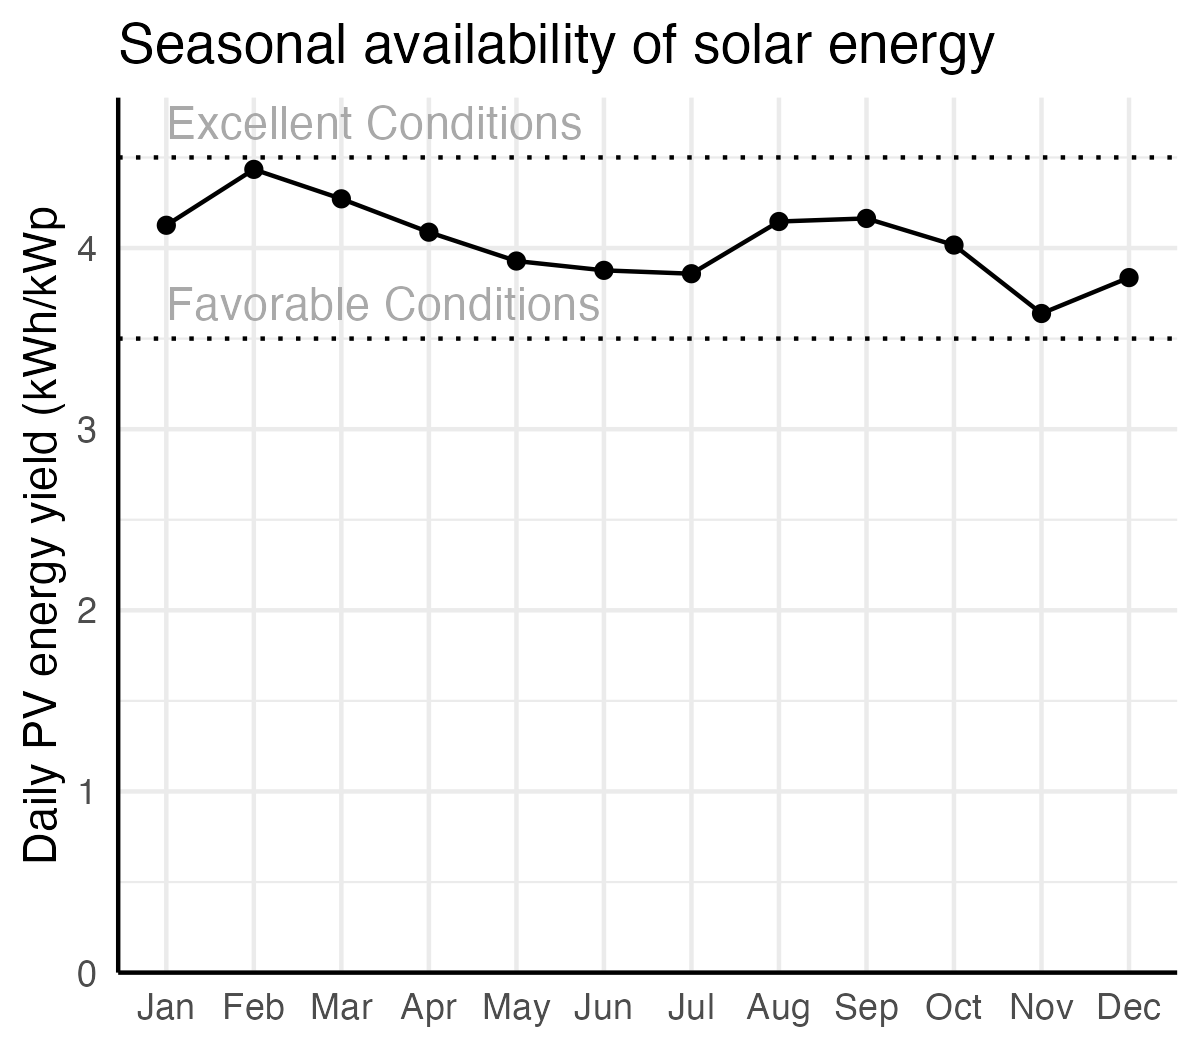
- Conditions for solar energy generation are favorable throughout the year, with very low seasonality
Solar electricity offers a unique opportunity to achieve long-term energy sustainability goals. Photovoltaics (PV) is the most widely applied and versatile technology for solar power. The availability of solar energy depends on site conditions. This map displays an indicative estimate of daily specific yield, that is, how much energy a hypothetical PV system would produce for per unit of capacity (kWh/kWp). Values above 4.5 are considered excellent availability, while values between 3.5 and 4.5 are moderate.
Map data obtained from the “Global Solar Atlas 2.0, a free, web-based application is developed and operated by the company Solargis s.r.o. on behalf of the World Bank Group, utilizing Solargis data, with funding provided by the Energy Sector Management Assistance Program (ESMAP). For additional information: https://globalsolaratlas.info
The Global Solar Atlas uses generalized theoretical settings for a quick assessment of PV power potential for a selected site. An optimum tilt angle of PV modules and 100% availability (no shutdowns due to failure) are assumed.
Vegetated Areas
Green spaces in Majuro appear prominent throughout the atoll, particularly in Laura and in hotspots in Delap- Uliga-Djarrit, particularly in the Uliga district and in Rairikku.
This map displays the Normalized Difference Vegetation Index, which ranges between -1 and 1, with higher numbers indicating a higher density of green vegetation. Values of less than 0.1 typically indicate water, rock, and otherwise barren land; values of 0.1 to 0.3 are associated with shrubs and grassland; 0.3 to 0.5 corresponds to moderate vegetation; and values of more than 0.5 correspond to dense vegetation such as forests or mature crops.
Vegetation and green spaces in cities are associated with health benefits and the mitigation of environmental risks. More green space in a city can reduce temperatures and the urban heat island effect, lessen air pollution, and absorb floodwaters. Green spaces can also serve important civic, social, and quality of life functions.
Map data from European Space Agency, 2020, “Normalized Difference Vegetation Index”.
NDVI-based measures do not account for the proximity and spatial arrangement of green spaces within areal units. They also do not address the vertical dimension and density of green urban buildup.
Risk Identification
Elevation
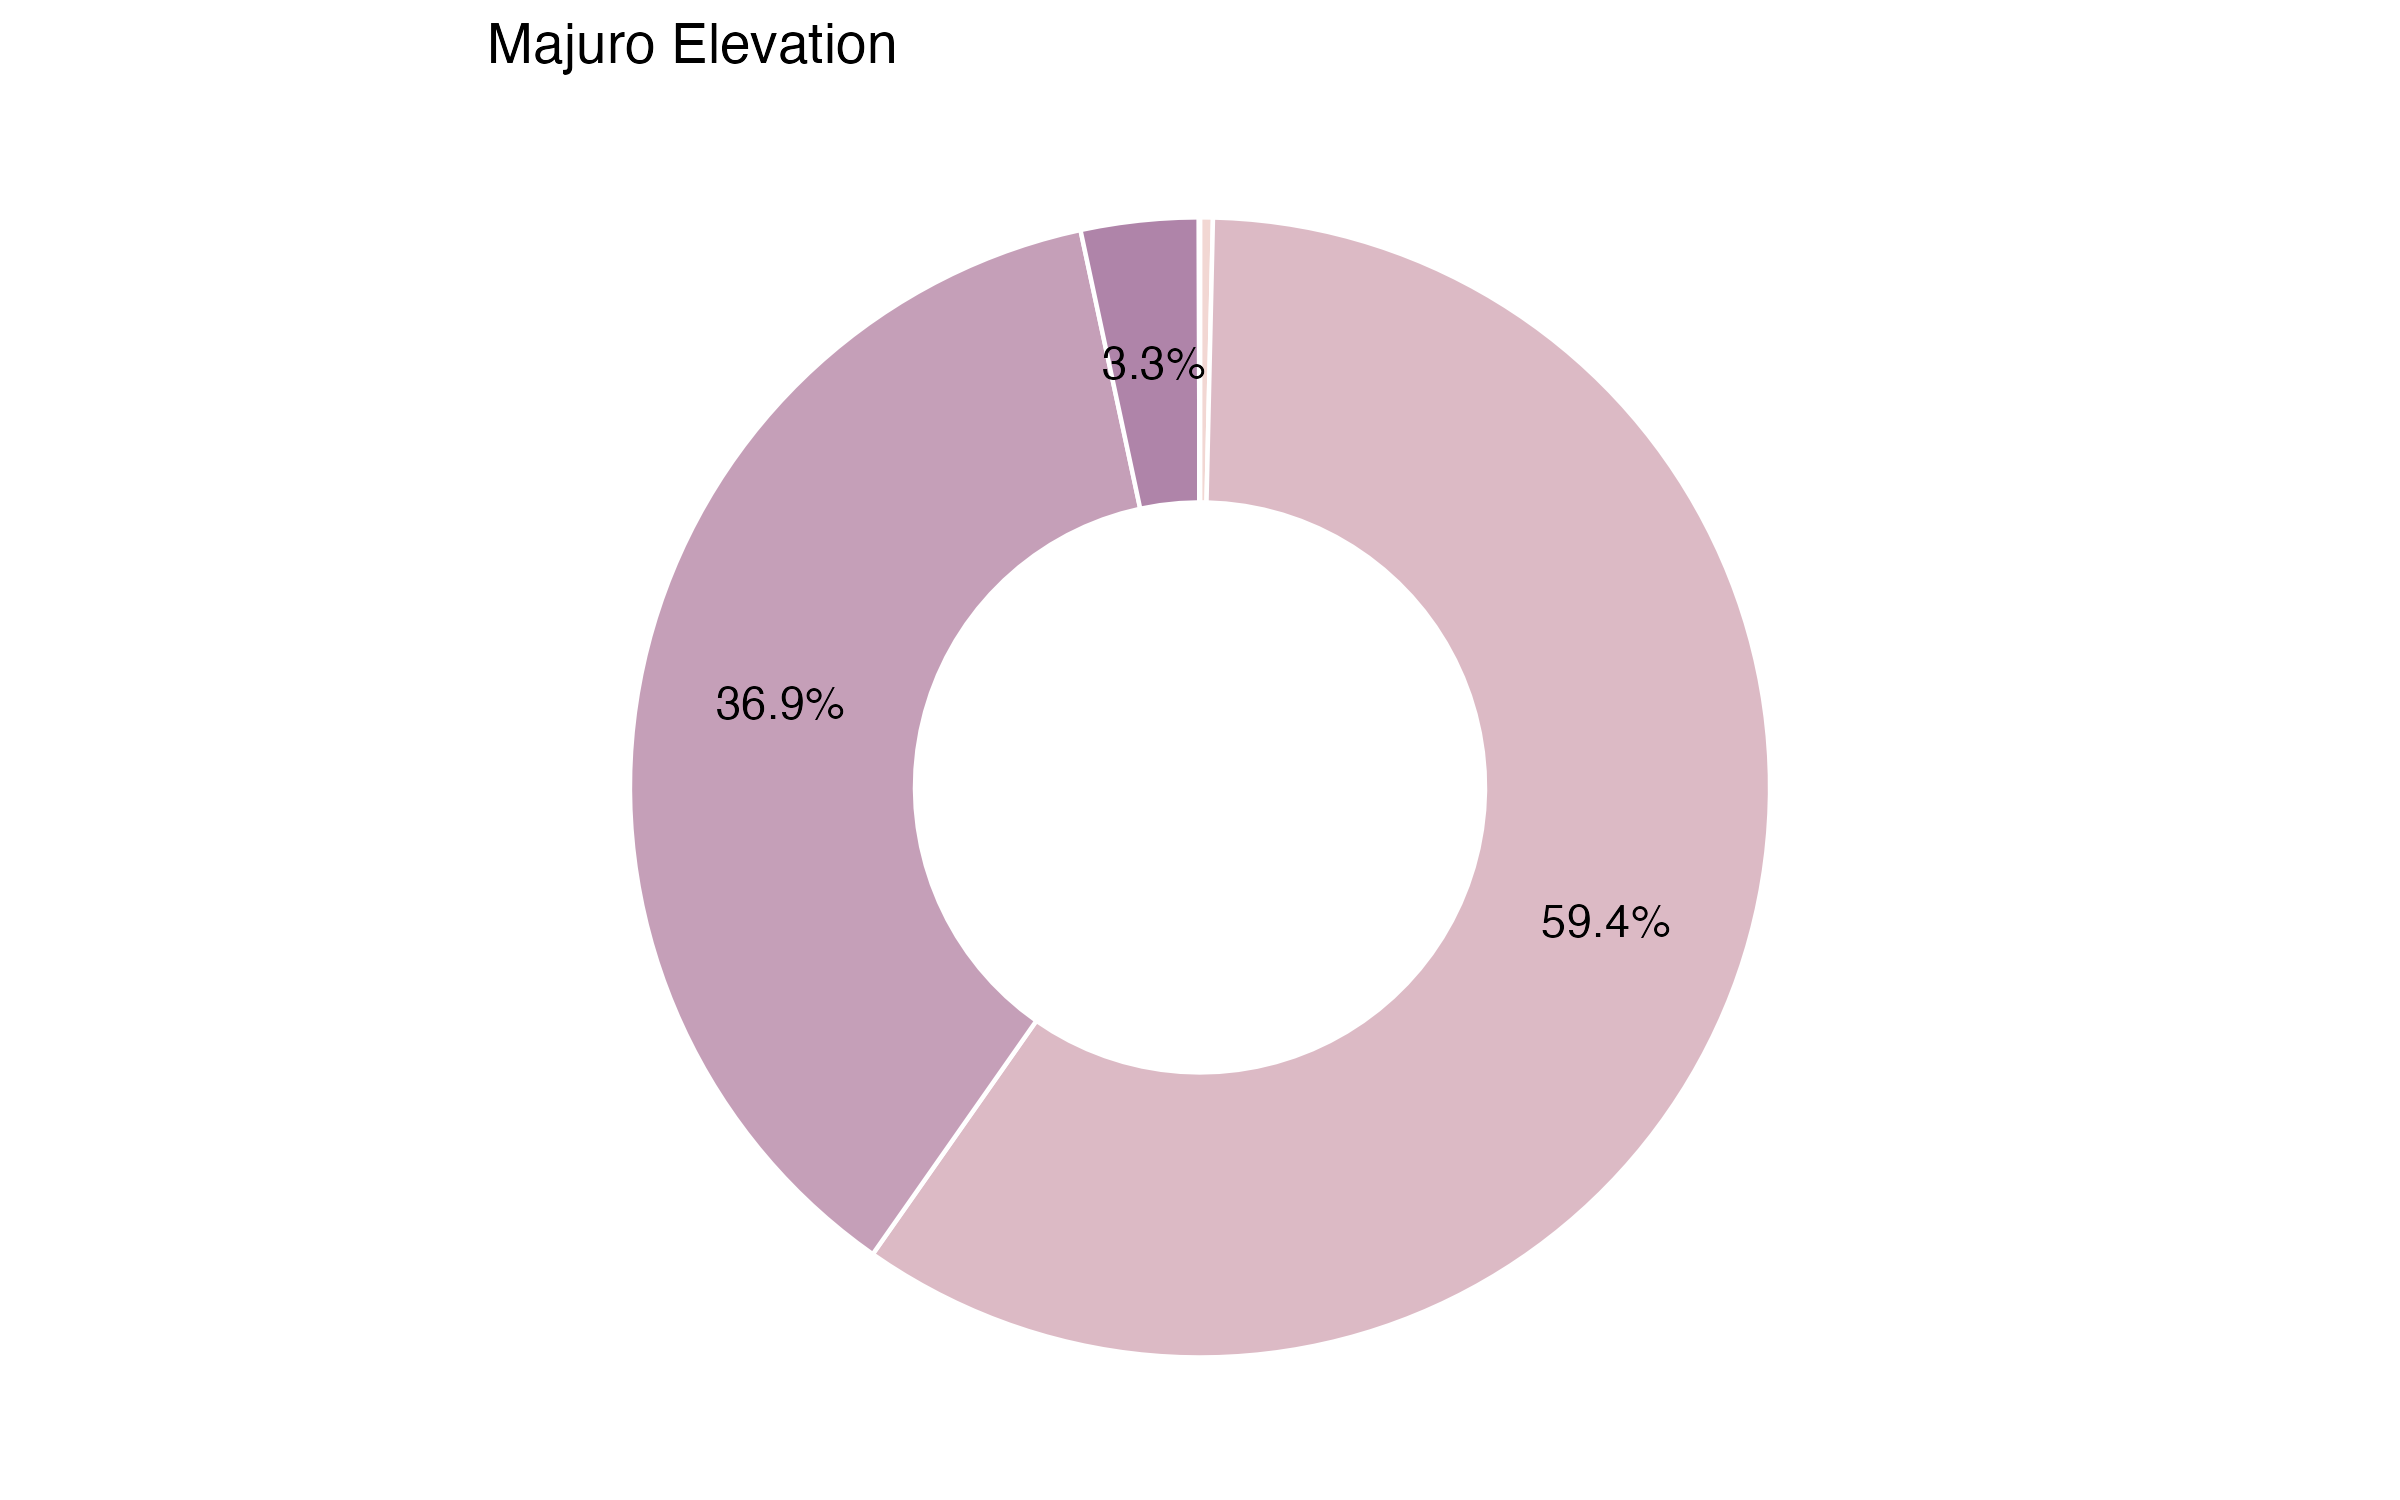
Much of Majuro’s inhabited land lies between -2 and 2 meters in elevation (60%). The elevation rises to 2-5.5 meters, mainly in the atoll’s eastern zones.
Elevation informs an area’s vulnerability to many natural disasters. The height at which infrastructure, resources, and communities sit relative to normal water levels and tides, flood waters, and storm surges and waves informs their exposure. Elevation information is critical for communities to anticipate the impacts of disasters and to prepare resilient and cost-effective response and redevelopment strategies.
Map data from FABDEM V1-2.
Slope
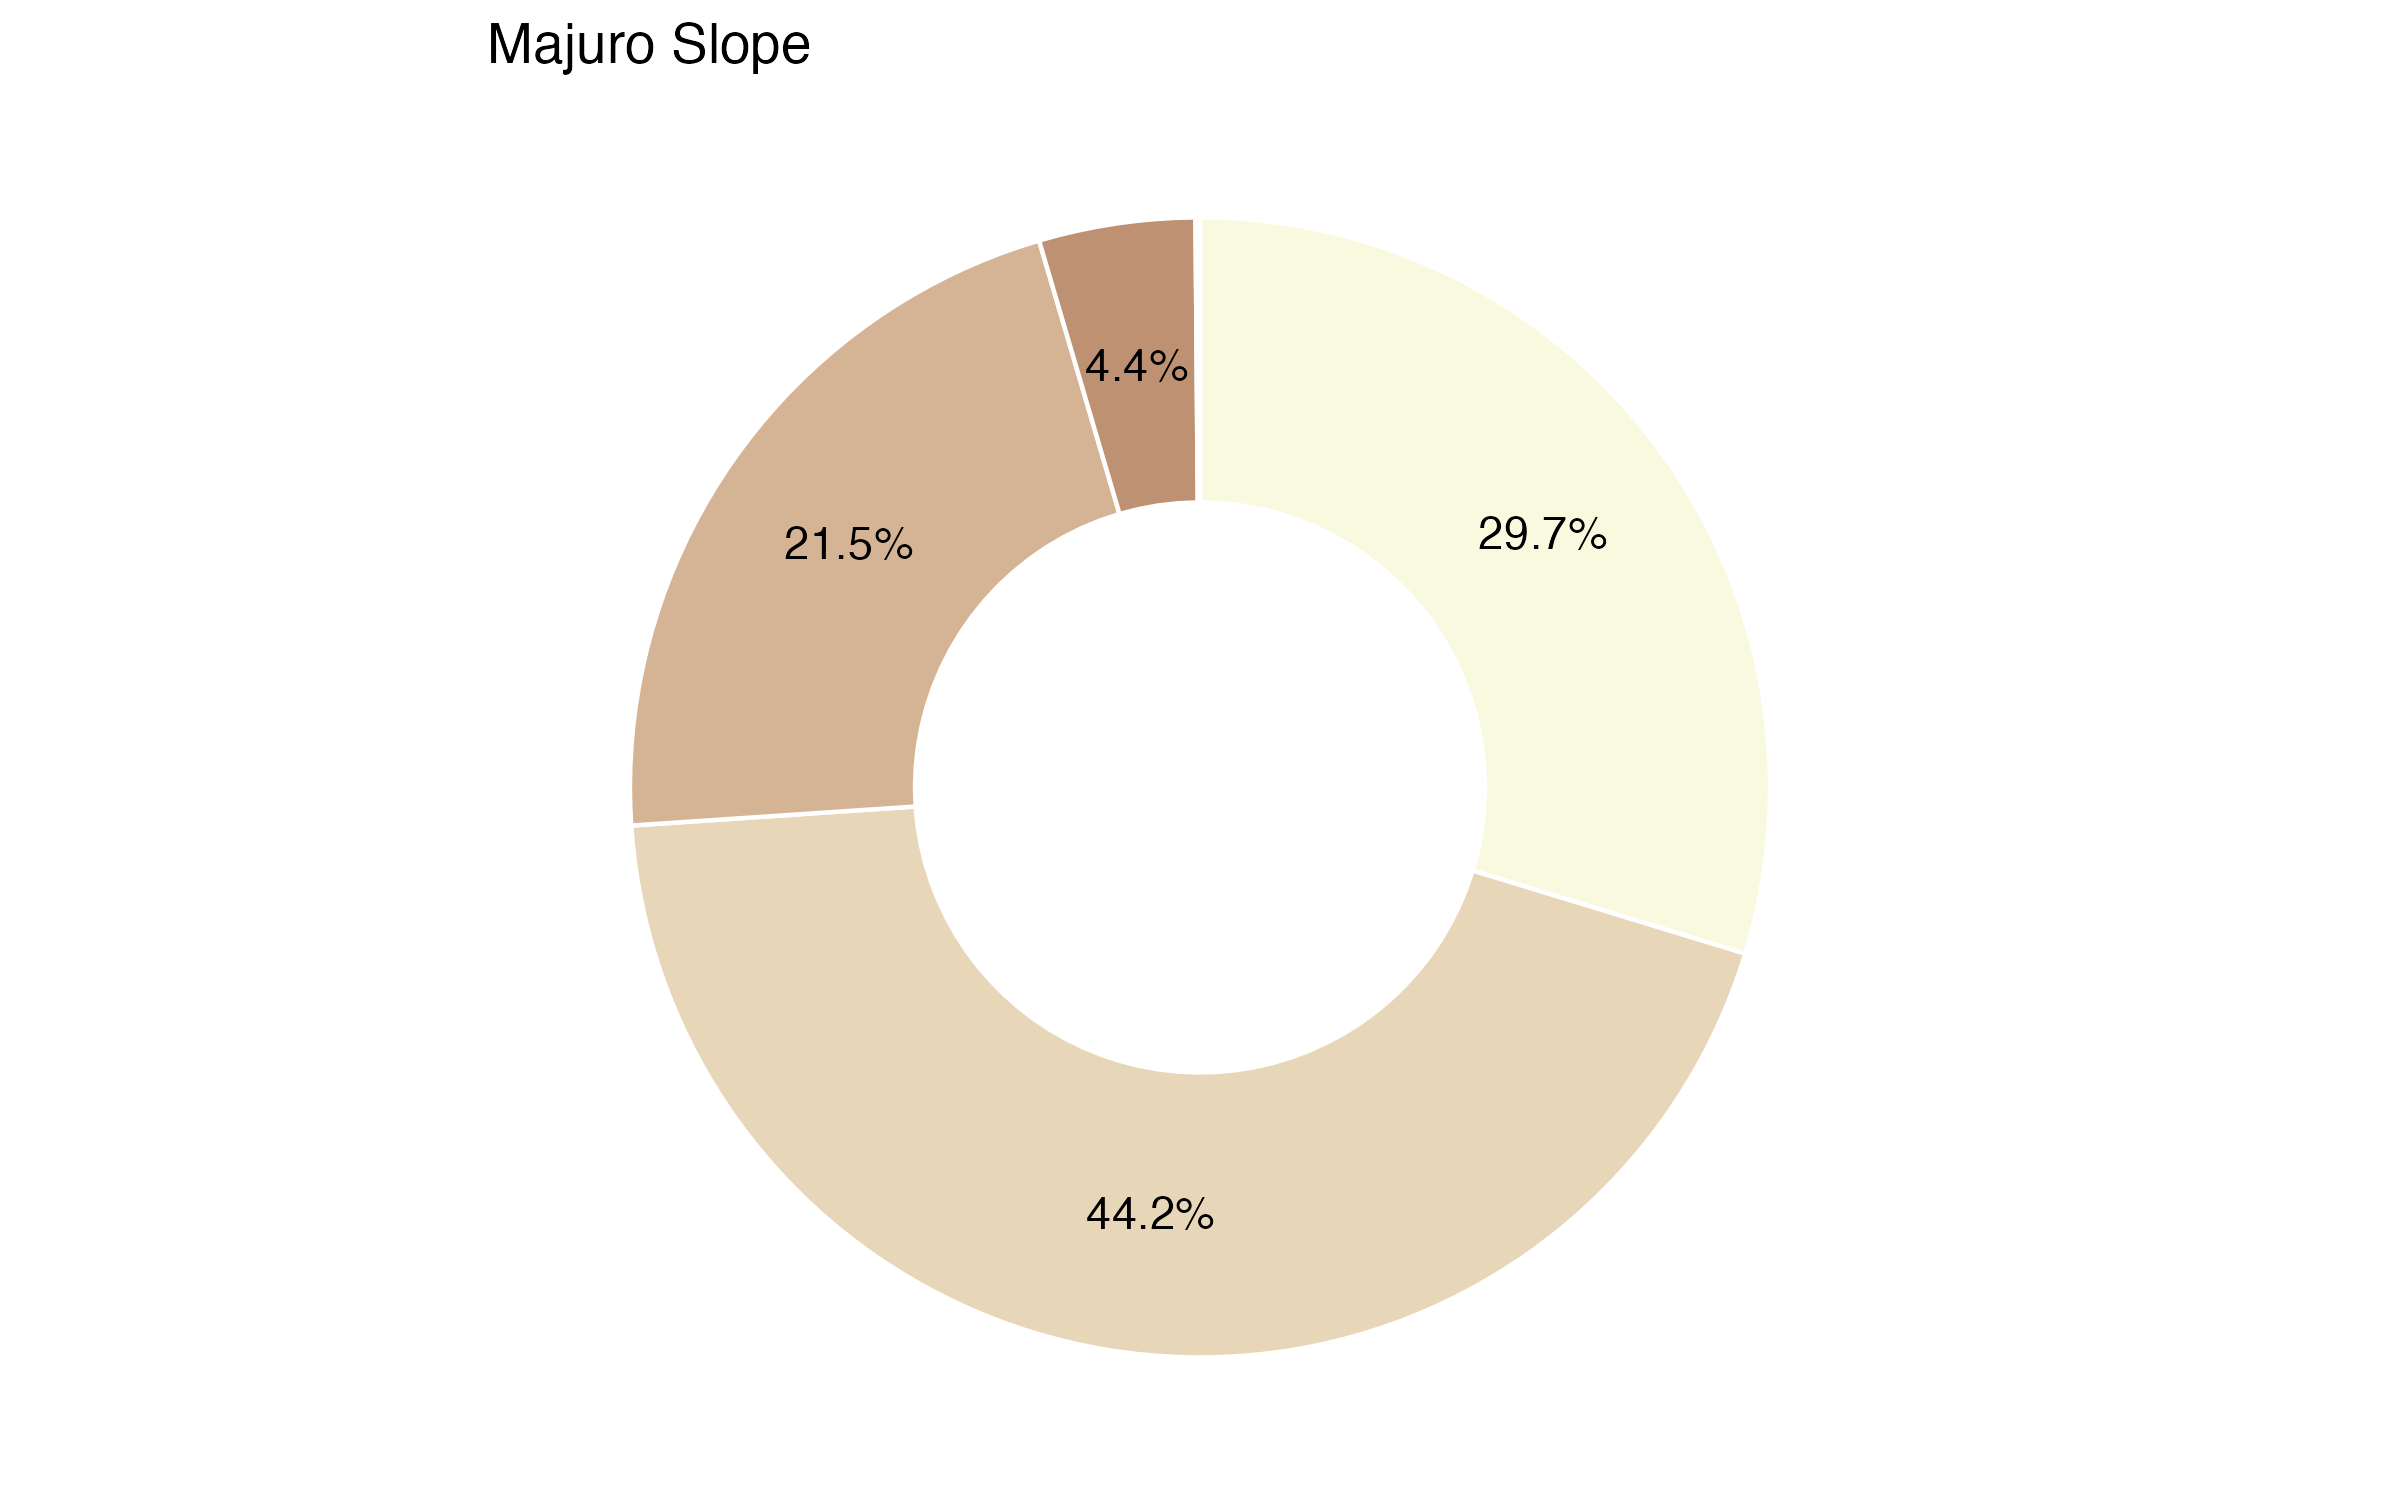
Most of the land in Majuro is gently sloping (3 degrees or less). A few (24%) hilly zones (3-6 degrees) are notable in the east and south zones.
Slope refers to the percentage change in elevation over a certain distance. In hilly or mountainous areas, floods can occur within minutes after heavy rains, while in flat areas, floodwaters can remain for days. Considering the slope of land is important in reducing construction costs, extending services and public facilities, minimizing the risks of hazards like flooding and landslides, and mitigating the impacts of development on natural resources.
Map data from USGS, 2015, “USGS EROS Archive - Digital Elevation”.
Landslides
Given its geographic condition as a low-sloping, flat atoll, Majuro’s susceptibility to landslides is very low.
This indicator refers to the likelihood that a landslide will occur in a particular area based on local terrain conditions. It shows the degree to which a terrain can be affected by slope movements, i.e., an estimate of “where” landslides are likely to occur. Susceptibility does not, however, consider the temporal probability of failure (i.e., when or how frequently landslides occur), nor the magnitude of the expected landslide (i.e., how large or destructive the failure will be).
This map combines satellite observations of rainfall with an assessment of the underlying susceptibility of the terrain. Steep slopes are the most important factor in a landscape’s susceptibility to landslides. Others include deforestation, presence of roads, strength of the bedrock and soils, and location of fault lines.
Map data from NASA, “Landslide Susceptibility Map”.
Liquefaction
- Most of Majuro has a very low liquefaction susceptibility
- Susceptibility is very high, though, in a number of areas between Laura and Delap-Uliga-Darrit
While all of the city has the same likelihood of seismic activity, areas within a city will typically have differing levels of vulnerability, due to factors such as soil and building construction. Liquefaction is a phenomenon where loosely packed or waterlogged sediments, particularly beneath buildings and under structures, lose their strength in response to strong ground shaking. Liquefaction in the event of an earthquake can cause increased damages.
This map calculates the likelihood of liquefaction using a combination of indicators such as peak ground velocity, precipitation and others. Each level determines a threshold of confidence regarding the probability of liquefaction in the particular pixel area.
Map data from Zorn & Koks, 2019.
roads
The most critical road segments are found along Lagoon road.
This layer visualizes an approximation of road network criticality. It highlights segments within a road network that, if blocked due to flooding or other hazards, would cause a high degree of disruption to travel across the city. Segments in red are the most critical for the overall connectivity of the city.
Note that cities vary substantially in their probability of disruption due to failure of a small number of road segments; for example, when a street network follows a grid pattern or has many alternative routes between destinations, the risk of disruption owing to the failure of key road segments is lower. In contrast, other cities have particular road segments whose failure would affect a large proportion of journeys across the city.
Map data from OpenStreetMap.
Criticality is measured by calculating betweenness for each segment. Betweenness for a segment is calculated by mapping the shortest path from each intersection to every other intersection, and then taking the percentage of all trips that use that segment.
Burnable Area
Much of Majuro has a moderately burnable land cover type
This layer visualizes the burnability factor of each land cover classification, based on assigning a binned weighting factor to represent burnability of each land classification. As per Four Twenty Seven’s research and Gannon and Steinberg’s (2021) research, global trends in historical wildfire intensity and occurrence of wildfire in each land cover classification is converted into a single burnability factor.
© ESA Land Cover CCI 2020/ Gannon et.al 2021
Local Institutions & Planning
Administrative Structure
The government of the Republic of the Marshall Islands operates under a mixed parliamentary- presidential system comprising an executive branch, a legislative branch and a judicial branch. Elections are held every year with each of the constituencies from the country’s 24 atolls electing one or more representatives to the Nitijela, the country’s legislature. Majuro atoll elects 5 representative to the Nitijela.
Majuro is the administrative center of the Republic of the Marshall Islands. The atoll consists of 64 islets, governed by the Majuro Atoll Local Government (MALGOV), and acts under the Constitution of the Majuro Atoll Local Government. MALGOV is led by an elected mayor and a fifteen- member council.
Availability Of Development Plans And Policies
The Republic of the Marshall Islands’s National Strategic Plan (NSP) is the country’s overarching government planning and budgeting guide for 2020-2030. The NSP highlights threats posed by climate change to Marshallese lives and livelihoods and the need to build resilience and proposes immediate investment in coastal protection; climate-proofing critical infrastructure; food, water, and health security; and early warning systems and disaster risk reduction measures.
The RMI National Climate Change Policy Framework (NCCPF) sets out the government’s commitments and responsibilities to address climate change in the Marshall Islands.
The Joint National Action Plan on Climate Change Adaptation and Disaster Risk Management 2014- 2018 (JNAP) outlines the country’s risk profile, and provides a rationale to support the integration of climate change adaptation and disaster risk management work, highlights the linkages to international and regional frameworks, and sets out objectives and key result areas for implementation.
The State of Urban Infrastructure and Service Delivery
Land Administration
In the Marshall Islands, land ownership is customary and is restricted to natural- born Marshallese citizens. In 2003, the government established the Marshall Islands Development Land Registration Authority to facilitate public registration of land available for development. However, the absence of public land ownership is a significant barrier to foreign investment in the Marshall Islands. Laws prevent non-Marshallese from purchasing land, forcing foreign businesses to lease land from private landowners to operate in the country.
Housing
Most of the Majuro urban area that comprises the connected islets of Delap-Uliga- Djarritt is well developed, with little undeveloped land remaining. Land tenure is a major constraint to improving housing and infrastructure development. Limited land availability and land tenure issues have caused urban sprawl towards the villages that extend from Laura and Rairok. Much peri-urban housing development occurs in Majuro, though no government agency is responsible for urban planning. As a result of considerable social and economic inequalities in Majuro, housing and living conditions vary from well-built, spacious houses to overcrowded shelters constructed of recycled, corrugated iron along the shorefront.
Electricity
Access to electricity in the Marshall Islands was reported at 94.64 % of the population in 2016. The Marshalls Energy Company is a state-owned electricity utility that generates, distributes, and retails electricity in Majuro. Between 2011 and 2016, Majuro’s annual consumption decreased from 62.6 GWh to 53.7 GWh, partly attributable to the implementation of a pre-paid residential metering program. Several large solar projects totaling 1 megawatt have been built on Majuro since 2000. However, in Majuro, there is very little space readily available for the footprint required by large renewable projects. In 2018, Majuro’s electricity grid produced 74 % of the electricity sector’s GHG emissions.
Disaster Risk Management
The Marshall Islands Disaster Management Office (NDMO) is responsible for identifying, developing, and implementing disaster management programs in Majuro. Buildings and communities in the urban atolls of Majuro are at high risk of inundation from sea-level rise. Without any form of adaptation, 37% of Majuro’s building stock is at risk of permanent inundation from a 1 m sea-level rise. All the settlements in Majuro are connected to critical facilities and the airport by the atoll’s main connector, Lagoon Road, which is critically exposed to inundation from a 1 m sea-level rise. In addition to sea swells, king tides, and typhoons, Majuro is also vulnerable to extended dry periods, most recently affecting the atoll in 2013.
Drinking Water Supply
The proportion of Majuro’s urban population connected to the primary water supply system is estimated at 30%. Many residents depend on community-based or individual water catchment systems, as freshwater is limited in supply. Rainwater is the primary source of freshwater in Majuro. In addition to the airport runway, which is used as a water catchment, some freshwater is pumped from seven wells in Laura. Reservoirs then store the retrieved water. Expanding water supply at the household level has been the focus of recent attempts to improve the sustainability of urban services, which has mainly been implemented through improved guttering and the installation of tanks.
Urban Roads & Transport
The Port of Majuro is the primary gateway for incoming imports that support consumer needs, the operation of private businesses and local and national government agencies, and related jobs in both the private and public sectors of the economy. There is an estimated 57 km of paved road on the Majuro atoll. The atoll’s central artery, Lagoon Road, connects the west and east ends of the Majuro. Two commercial dock facilities in Majuro furnish port facilities for international shipping. Delap Dock is the primary commercial cargo dock in Majuro Atoll. The Uliga Dock is used for the moorage of governmental vessels owned and operated by Marshall Island Marine Resources Authority, Ministry of Transportation and Communications and RMI Ports Authority.
Solid Waste Management
Coverage of urban services and infrastructure in squatter and informal housing areas in Majuro is under-serviced. Waste management is a major issue, as disposed cars, used containers, vessels, and other metal structures line Majuro’s foreshore. The Majuro Atoll Waste Management Company oversees the collection, treatment, storage, and disposal of waste on Majuro, as well as recycling. The reticulated sewage system covers an estimated 80% of Majuro’s population, primarily supplemented with septic tank systems and a formal septic disposal system. The Solid Waste Management Plan for Majuro 2019-2028 targets proper final disposal. The atoll’s only public landfill is the highest point in the country.
Local Administration
Fish products are the Marshall Islands’s largest exports, with frozen fish being exported to Asia and fresh fish exported by air to Japan and Hawaii. Majuro is a key port for commercial fishing vessels, cruise liners, and sport fishing boats. US transfer payments under the Compact of Free Association account for most GDP. While the government is the largest employer, the private sector is active in Majuro in fish processing, real estate, and wholesale and retail business. Government employment dominates formal sector employment, accounting for 69% of total employment. The informal sector labor force comprises approximately 57% of women, and it accounts for 31% of total employment.
Source: Republic of the Marshall Islands - Reliefweb. (n.d.). Retrieved January 24, 2022, from https://reliefweb.int/sites/reliefweb.int/files/resources/disaster-mgmt-ref-hdbk-rmi_0.pdf. Marshall Islands - large.stanford.edu. (n.d.). Retrieved January 24, 2022, from http://large.stanford.edu/courses/2018/ph241/castandea2/docs/upei-2007.pdf. RRP sector assessment - adb.org. (n.d.). Retrieved January 27, 2022, from https://www.adb.org/sites/default/files/linked-documents/49450-006-ssa.pdf. “The state of Pacific Towns and cities - ADB. (n.d.). Retrieved January 24, 2022, from https://www.adb.org/sites/default/files/publication/29765/state-pacific-towns-cities.pdf
Key Considerations for Investment Planning & Prioritization
Concluding Questions
What is the most surprising result for you in this City Scan?
What patterns did this City Scan illuminate that you had not considered before?
What are your city’s critical development challenges?
What other information would you like in order to corroborate or amplify the information in this City Scan?
Who else would you like to speak with to gain further understanding about your city’s development challenges?
What investments need to be prioritized? What trade-offs are inherent in your prioritization?
What investments could be coordinated? What benefits would such coordination bring?
Last edited 2025-05-15.
This City Scan is a product of the City Resilience Program.
The findings, interpretations, and conclusions expressed in this City Scan do not necessarily reflect the views of the World Bank, the Executive Directors of the World Bank, or the governments they represent. Given that the data included in this work are derived from global sources, the World Bank does not guarantee its accuracy.