South Tarawa, Kiribati
South Tarawa, Kiribati
City Scan
May 2025
![]()
![]()
![]()
![]()
Executive Summary
Setting the Context
South Tarawa, a city sprawled over a string of islets on the Tarawa atoll, serves as the capital and hub of the Republic of Kiribati. Home to more than half of Kiribati’s entire population, most of the country’s government, commercial, and educational facilities are located in South Tarawa. This analysis includes all of South Tarawa, encompassing Betio, Bairiki, Nanikai, Banraeba, Eita, Bikenibeu, and Bonriki.
Population and Demographic Trends
South Tarawa’s population has grown by 108.7% from 1985 to 2020 with an average growth rate of 2.1% annually. In 2020, the area had a population of 44,643 people. A large portion of the population lives around Betio, Bairiki, Nanikai, and Bikenibeu.
City Competitiveness and Economic Activity
South Tarawa’s economy is primarily driven by state-owned enterprises and private business activities. Copra production and fish processing also contribute to economic activities.
Built Form
Most of the land outside the built-up area is grassland, followed by permanent water bodies. Schools and health facilities are well distributed throughout the area.
Climate Conditions
Solar energy potential is excellent in South Tarawa.
Risk Identification
Kiribati is amongst the most vulnerable nations in the world to climate change, with a range of natural hazards, including sea-level rise, coastal flooding, tsunamis, extreme heat, and cyclones, posing threat. Despite this, since 1985, there have been zero large flood events and zero earthquakes events recorded. The area has very low landslide susceptibility.
Local Institutions and Planning
Kiribati is a unitary republic with a two-tier government system comprising national and local levels. The Minister of Internal and Social Affairs oversees the local government, which consists of 26 councils made up of three town (urban) councils and 23 island (rural) councils. Councils provide various services, including education, healthcare, public sanitation, transportation, water supply, and economic regulation. Established in 2012, the Kiribati Local Government Association (KILGA) represents the interests of all councils at the national level.Setting the Context
Basic City Information
South Tarawa, a city sprawled over a string of isletts on the Tarawa atoll, serves as the capital and hub of the Republic of Kiribati. Home to more than half of Kiribati’s entire population, most of the country’s government, commercial, and educational facilities are located in South Tarawa. The city hosts both Kiribati’s main marine port, Betio Port, and the country’s international airport, Bonriki International Airport.
In addition to state-owned enterprises and private business activities that drive the local economy, copra production and fish processing also contribute to economic activities.
Kiribati is amongst the most vulnerable nations in the world to climate change, with a range of natural hazards, including sea-level rise, coastal flooding, tsunamis, extreme heat, and cyclones, posing threat to the extremely low-lying island nation. As climate change continues to impact weather patterns, the frequency and severity of these disasters are expected to increase, posing additional threats and compounding challenges for resilience.
The boundary lines mark the area of interest for the City Scan. These lines may differ from the city’s official administrative boundaries and may include multiple jurisdictions.
Population and Demographic Trends
Population Density
- South Tarawa’s overall population density is characteristic of medium-density urban areas in many parts of the world, but represents extremely high density for a Pacific island context, where most settlements have much lower density values
- Areas around Betio, Bairiki, Nanikai, and Bikenibeu are particularly dense
- Despite a modest total population size, the constrained geography of South Tarawa may create density-related challenges that are comparable to much more populous cities
This map estimates population numbers per 10,000 m2 grid cell. It provides a more consistent representation of population distributions across different landscapes than administrative unit counts. Knowing where people are is critical for impact assessments and intervention plans, especially those focused on service delivery, food security, climate change, network systems and natural disasters.
Population Growth
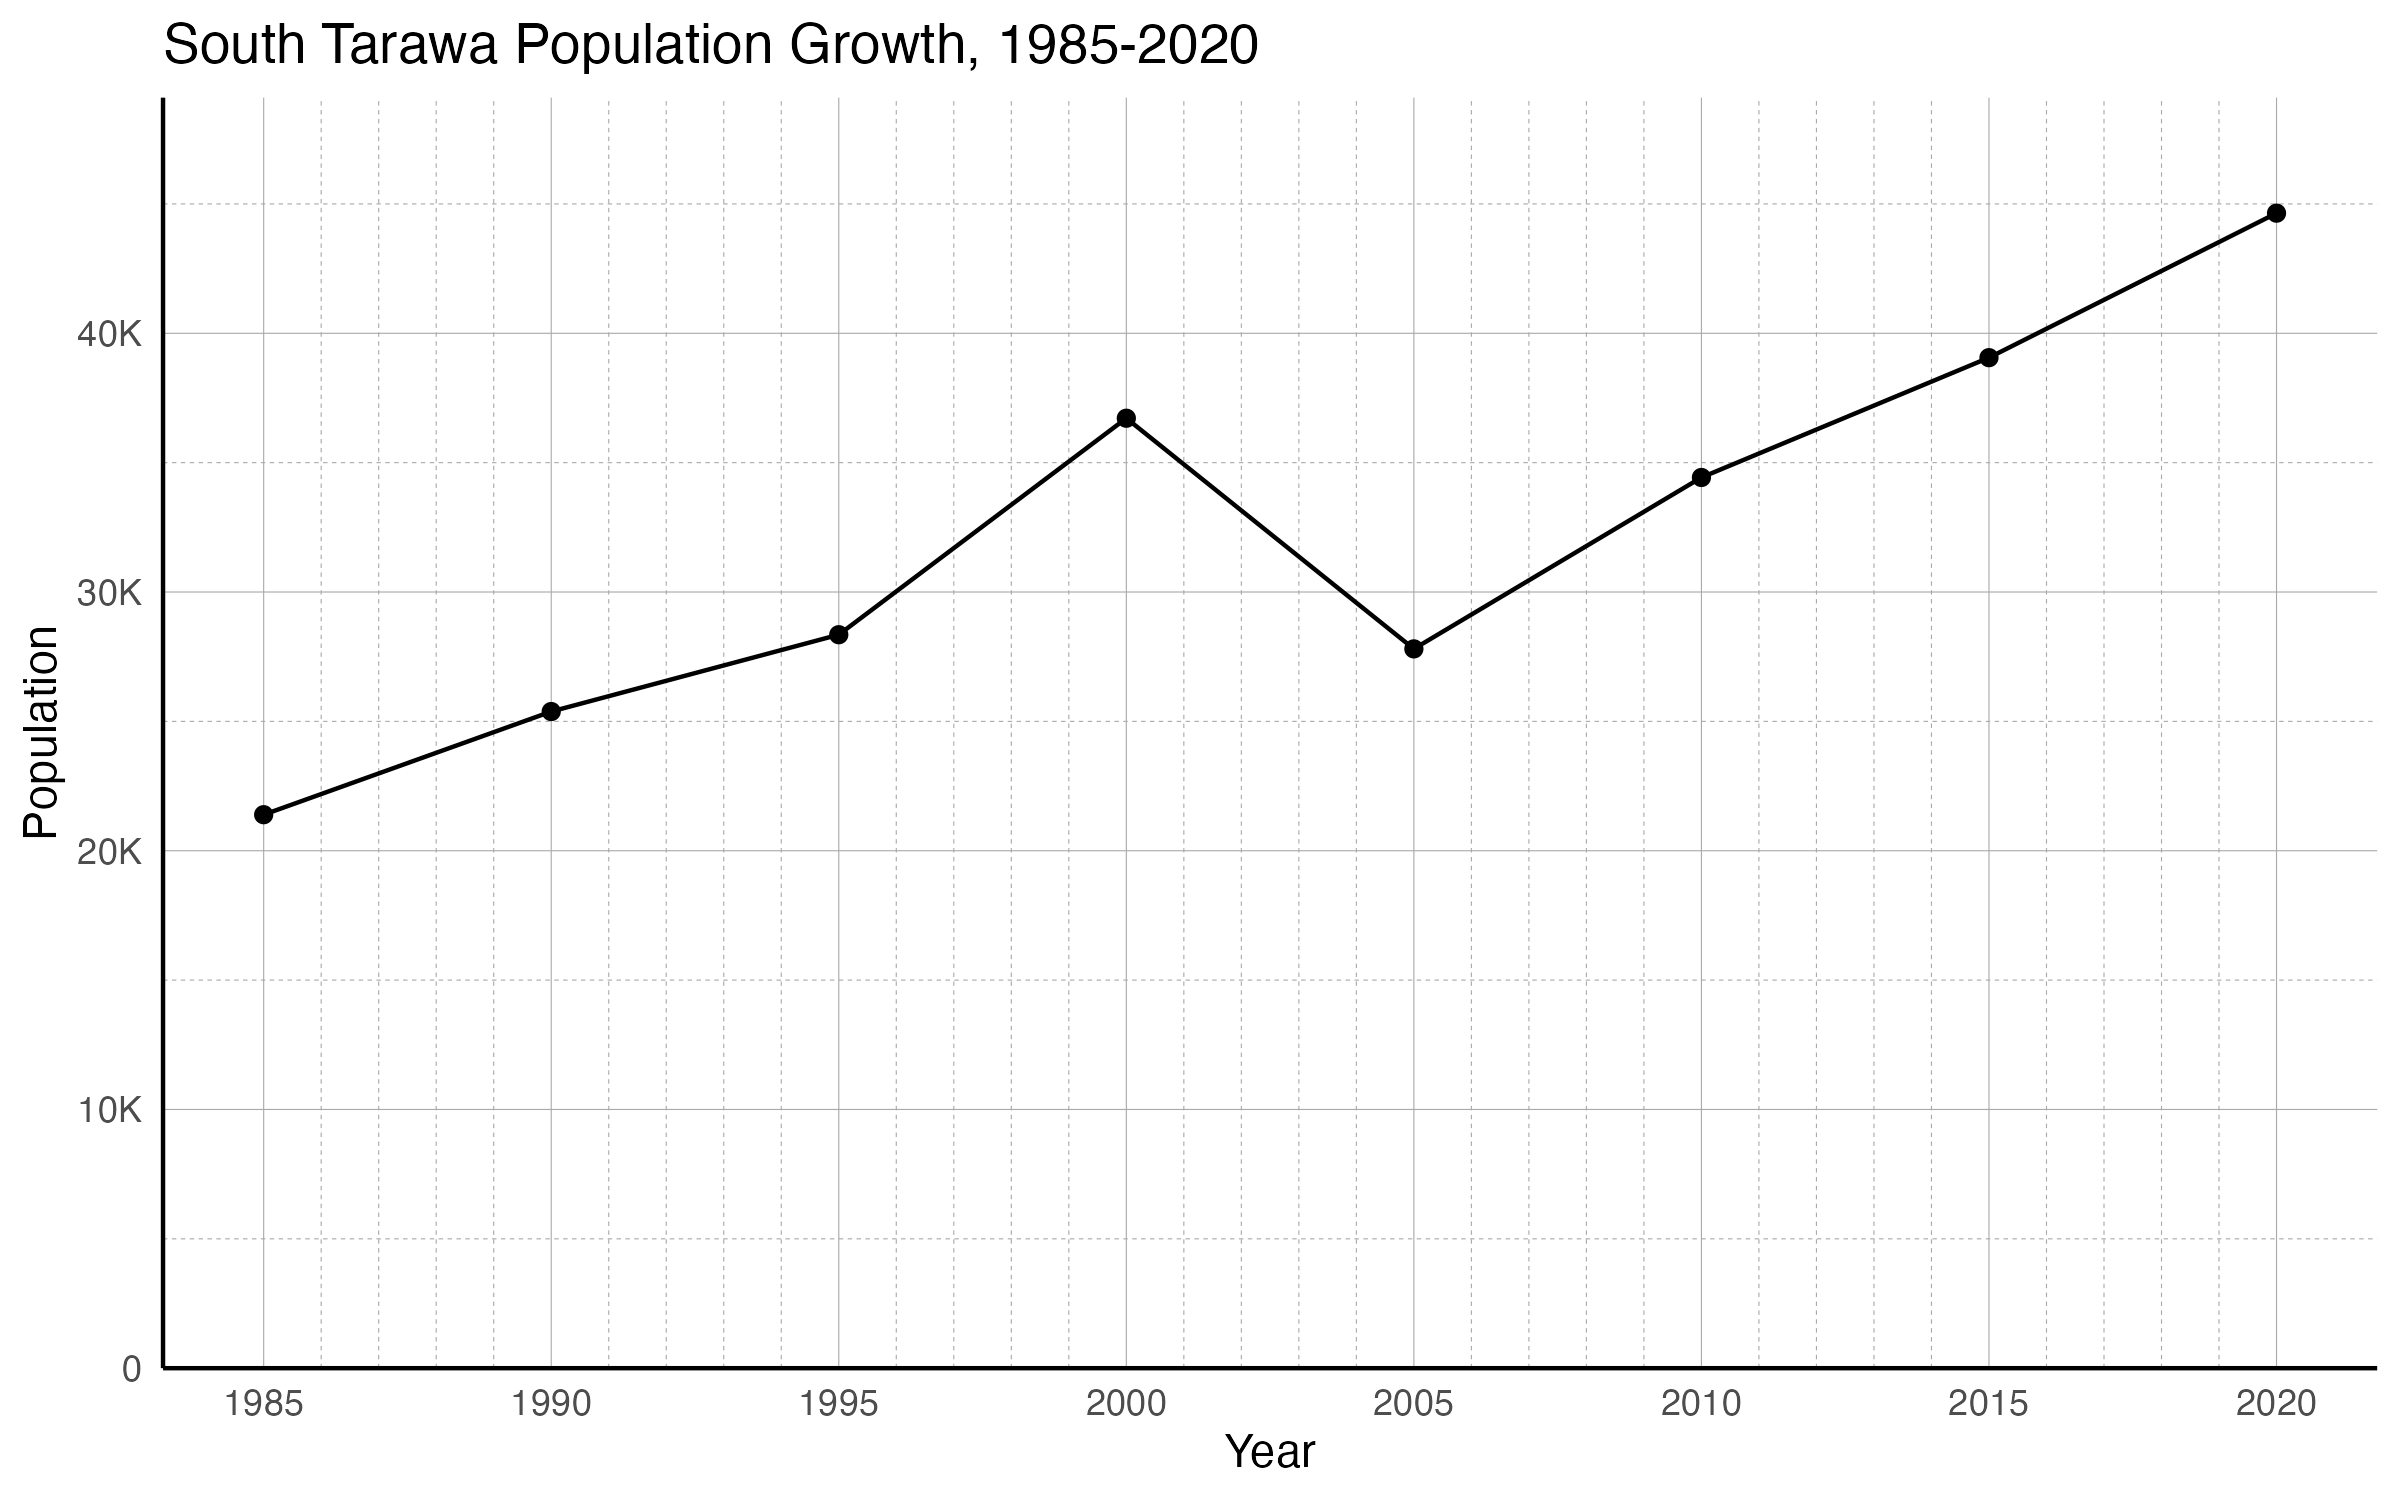
South Tarawa’s population increased by 108.7% from 21,393 in 1985 to 44,643 in 2020, at an average annual rate of 2.1%
Across this period there are three distinct phases of relative growth: there is an initial period of steady growth from 1985 through 1995, followed by accelerated growth to a peak in 2000, then a sharp decline to 2005, and finally resumed strong growth from 2005 to 2020
Population figures are typically used as a denominator for many indicators, and are a measure of demand for services. The line chart above summarizes the city’s population change according to census and other public data. High growth of urban populations, caused by rates of natural increase (more births than deaths) in urban areas, migration from rural to urban areas, and the transformation of rural settlements into urban places, puts pressure on cities to meet the new demand.
Population Density
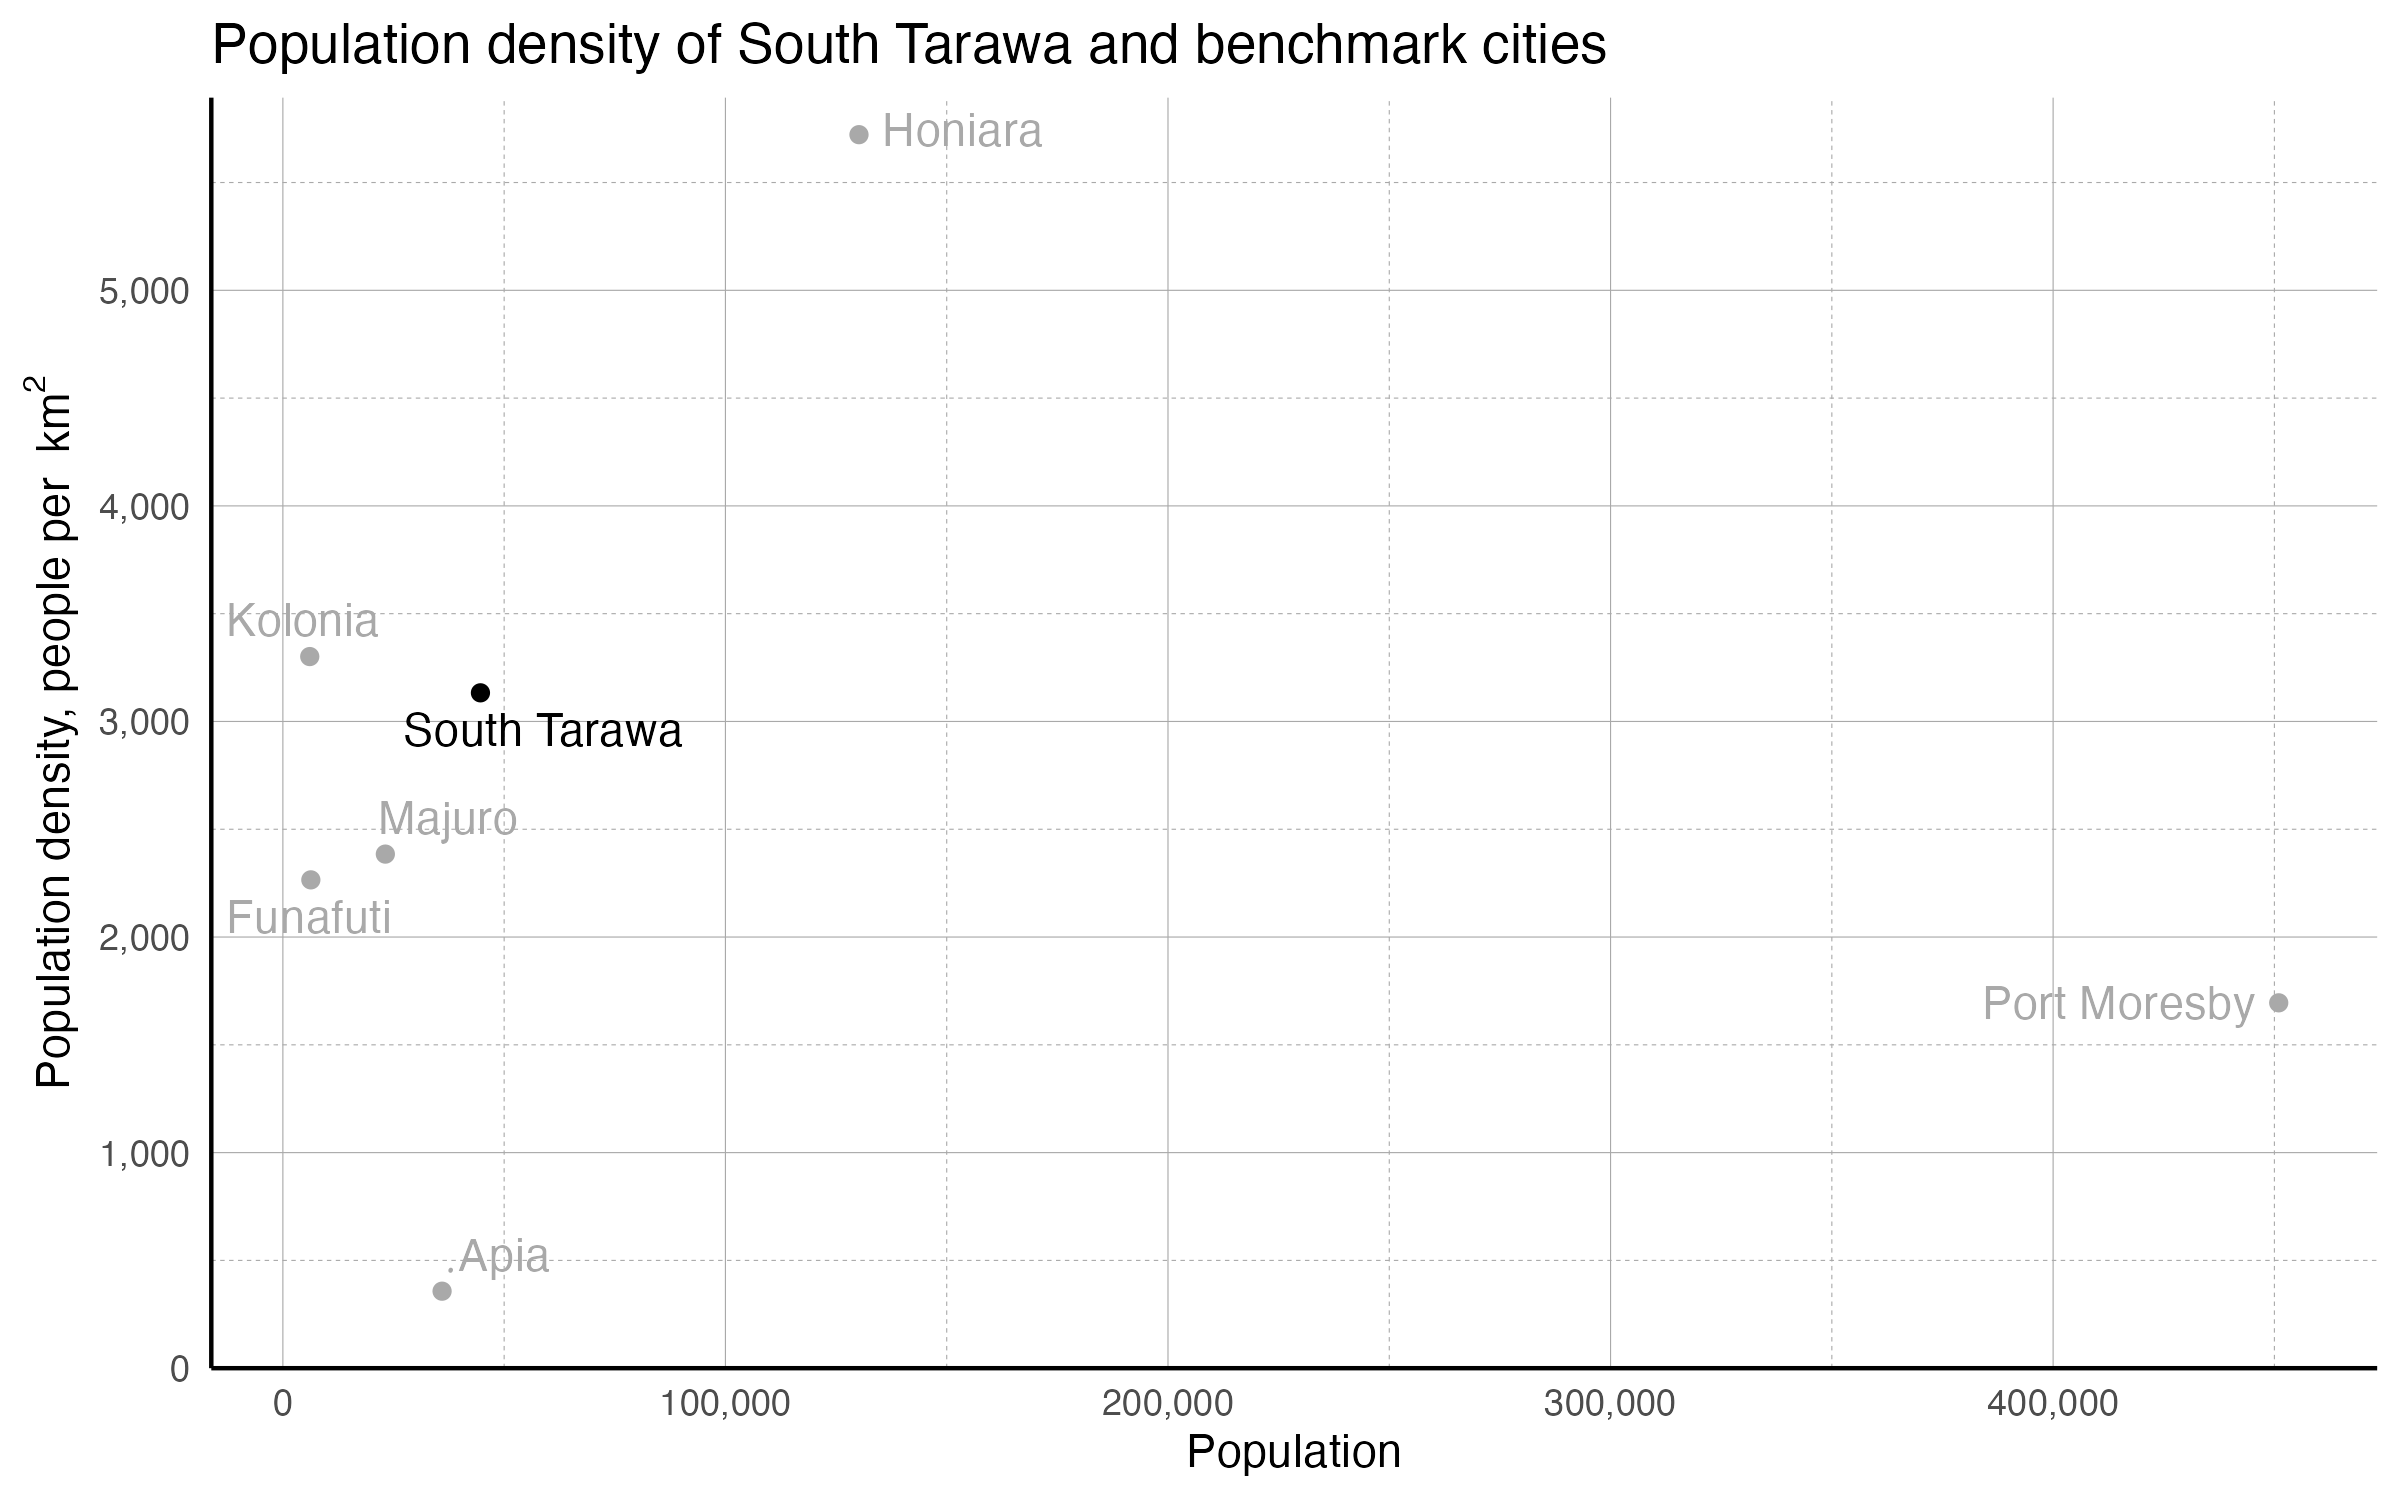
- With an area of 13.3 km2, South Tarawa has a population density of 3,133 people per km2
- Among the 7 regional benchmark cities, South Tarawa’s density is most similar to Kolonia’s
Density is calculated using the most recent census population recorded and the official land area occupied by the city, and is an important measure of how cities function. Higher population density enables governments to more easily deliver essential infrastructure and services in urban areas at relatively low cost per capita. However, such benefits do not materialize automatically or inevitably. Whether a city’s population dynamics pose challenges or offer opportunities typically depends on the policies in play.
Populations and area are from Oxford, 2022, “Oxford Economics” or CityPopulation.de. Note that Oxford Economics uses quite large extents for its cities, meaning that the measured density is likely considerably lower than the density experienced by most inhabitants of the cities. Extents used by the both data sources may differ from the AOIs used by the City Scans.
Population Distribution by Age & Sex
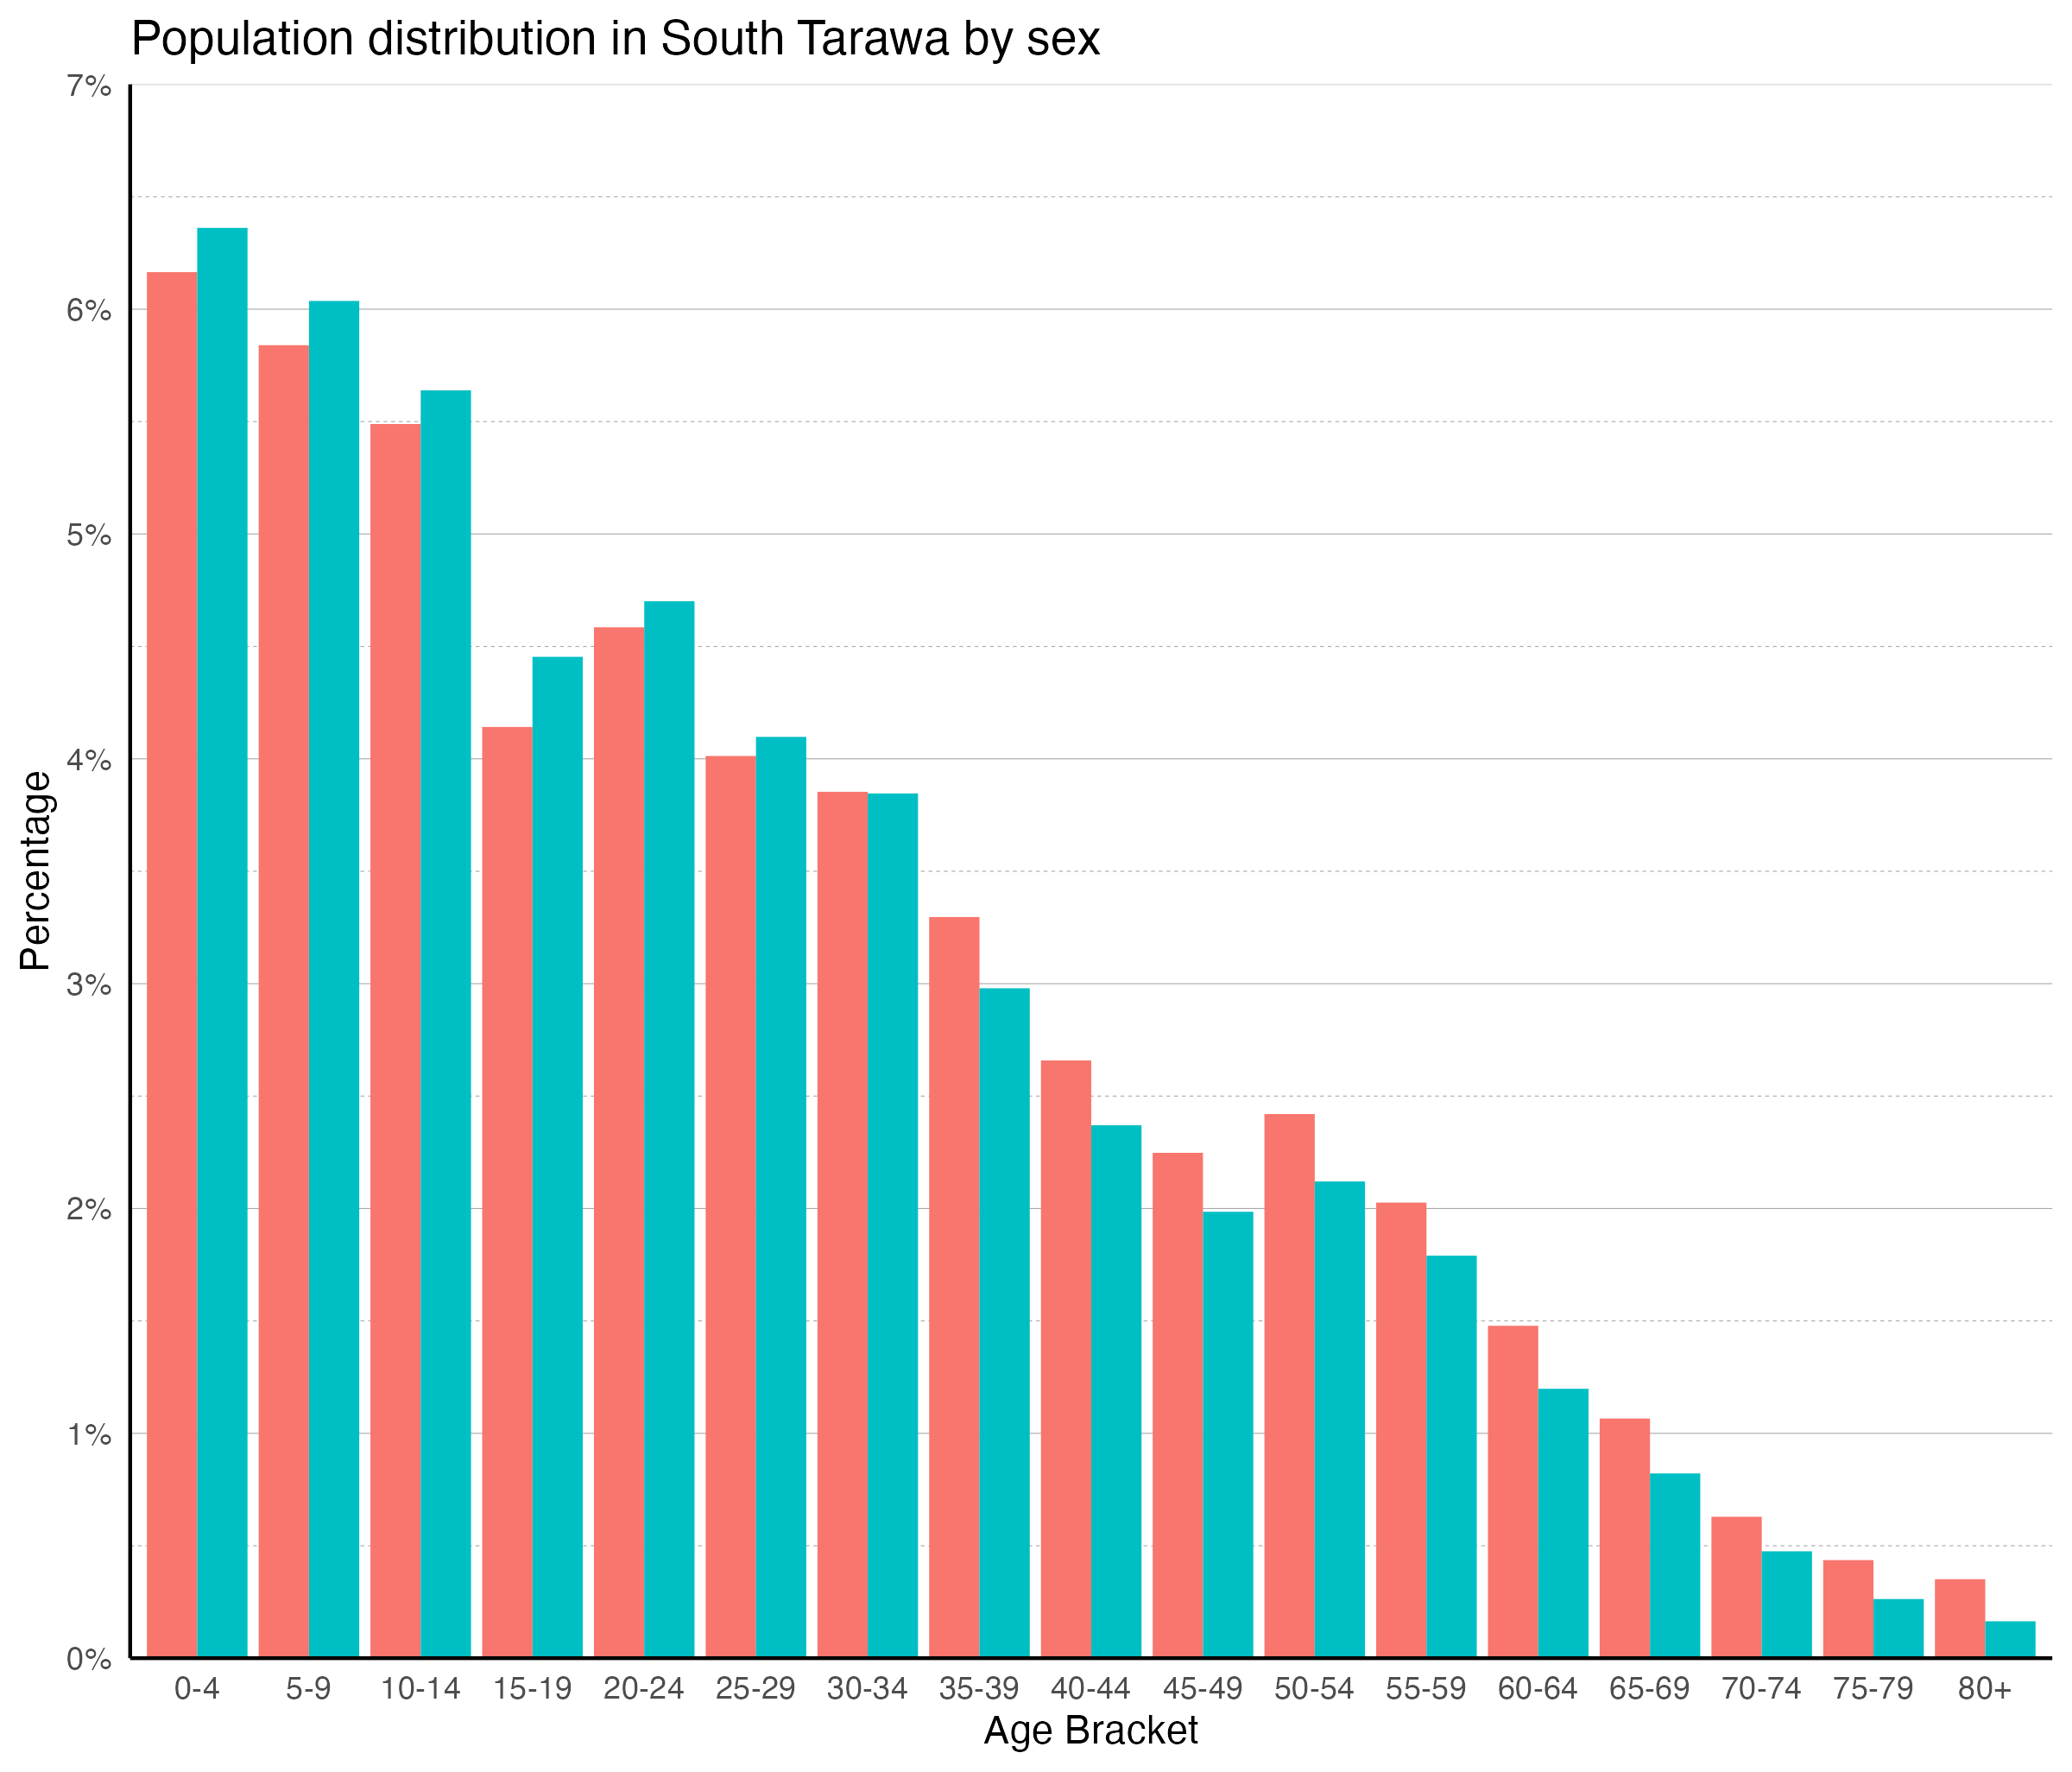
- South Tarawa’s population is fairly young, with 53% of people under the age of 25 and 60% of people of working age
- Only 7% of the population is 60 or older
- The largest age groups for males and females are ages 0–4
- There are less males than females in South Tarawa, with a ratio of 97.25:100
- 49% of all females in South Tarawa are of reproductive age
This column chart classifies the city’s population according to age group, forming the basis of population projections. Populations vary significantly in their proportions of young and old people, with growing populations generally appearing younger, and declining or slowly growing populations generally appearing older.
Data from WorldPop. Bondarenko, et al, Estimates of total number of people per grid square broken down by gender and age groupings for 51 countries across sub-Saharan Africa in 2020 using Ecopia.AI and Maxar Technologies building footprints, 2020.
Reproductive age is defined as 15–49. Working age is defined as 15–64.
Economic Activity
Economic Hotspots
- Using nighttime light radiance as a proxy for economic hot spots, economic activity appears to somewhat reflect population density, where apparent economic hot spots exist near the more populous Betio and around Bairiki and Bikenibeu
- Outside of these more populous areas, and to the degree that nighttime light radiance corresponds to economic hot spots, economic activity appears to be relatively low
This map measures the total emissions of nighttime lights from the monthly average of radiance for 2014 through 2022. Nighttime light radiance is a common proxy for economic activity: where there is more artificial light, there is generally more commercial activity. VIIRS observations are made fairly late at night, as its satellites cross the equator at around 1:30 local time; thus, the observed lights are typically street lights and nights which are left lit all night long. The correlation of nighttime light and economic activity is strongest for urban areas; it is less relevant in agricultural areas and areas with very low population density.
Map data from NOAA, “VIIRS Daily Mosaic”.
Change in Economic Hotspots
- Using the rate of change in nighttime light radiance as a proxy for change in economic hot spots, there appears to be positive growth in economic activity throughout almost all of South Tarawa
- The rate of change in nighttime light radiance is greatest in Betio, Bairiki, and Banraeba, indicating that economic activity may be increasing the most in these areas
- Off the northern coast of Betio and to a lesser degree near Bonriki, small nodes of negative change in nighttime light radiance exist, suggesting areas of potential economic activity decline
The map illustrates monthly temporal changes from 2014 to 2022 in the emission of nighttime lights, indicating changes in economic activity. Positive values represent an increase in the intensity of nighttime light emission and, by proxy, economic activity, while negative values represent a decrease in the intensity of nighttime light emission, and economic activity.
Map data from NOAA, “VIIRS Daily Mosaic”.
Built Form
Land Cover
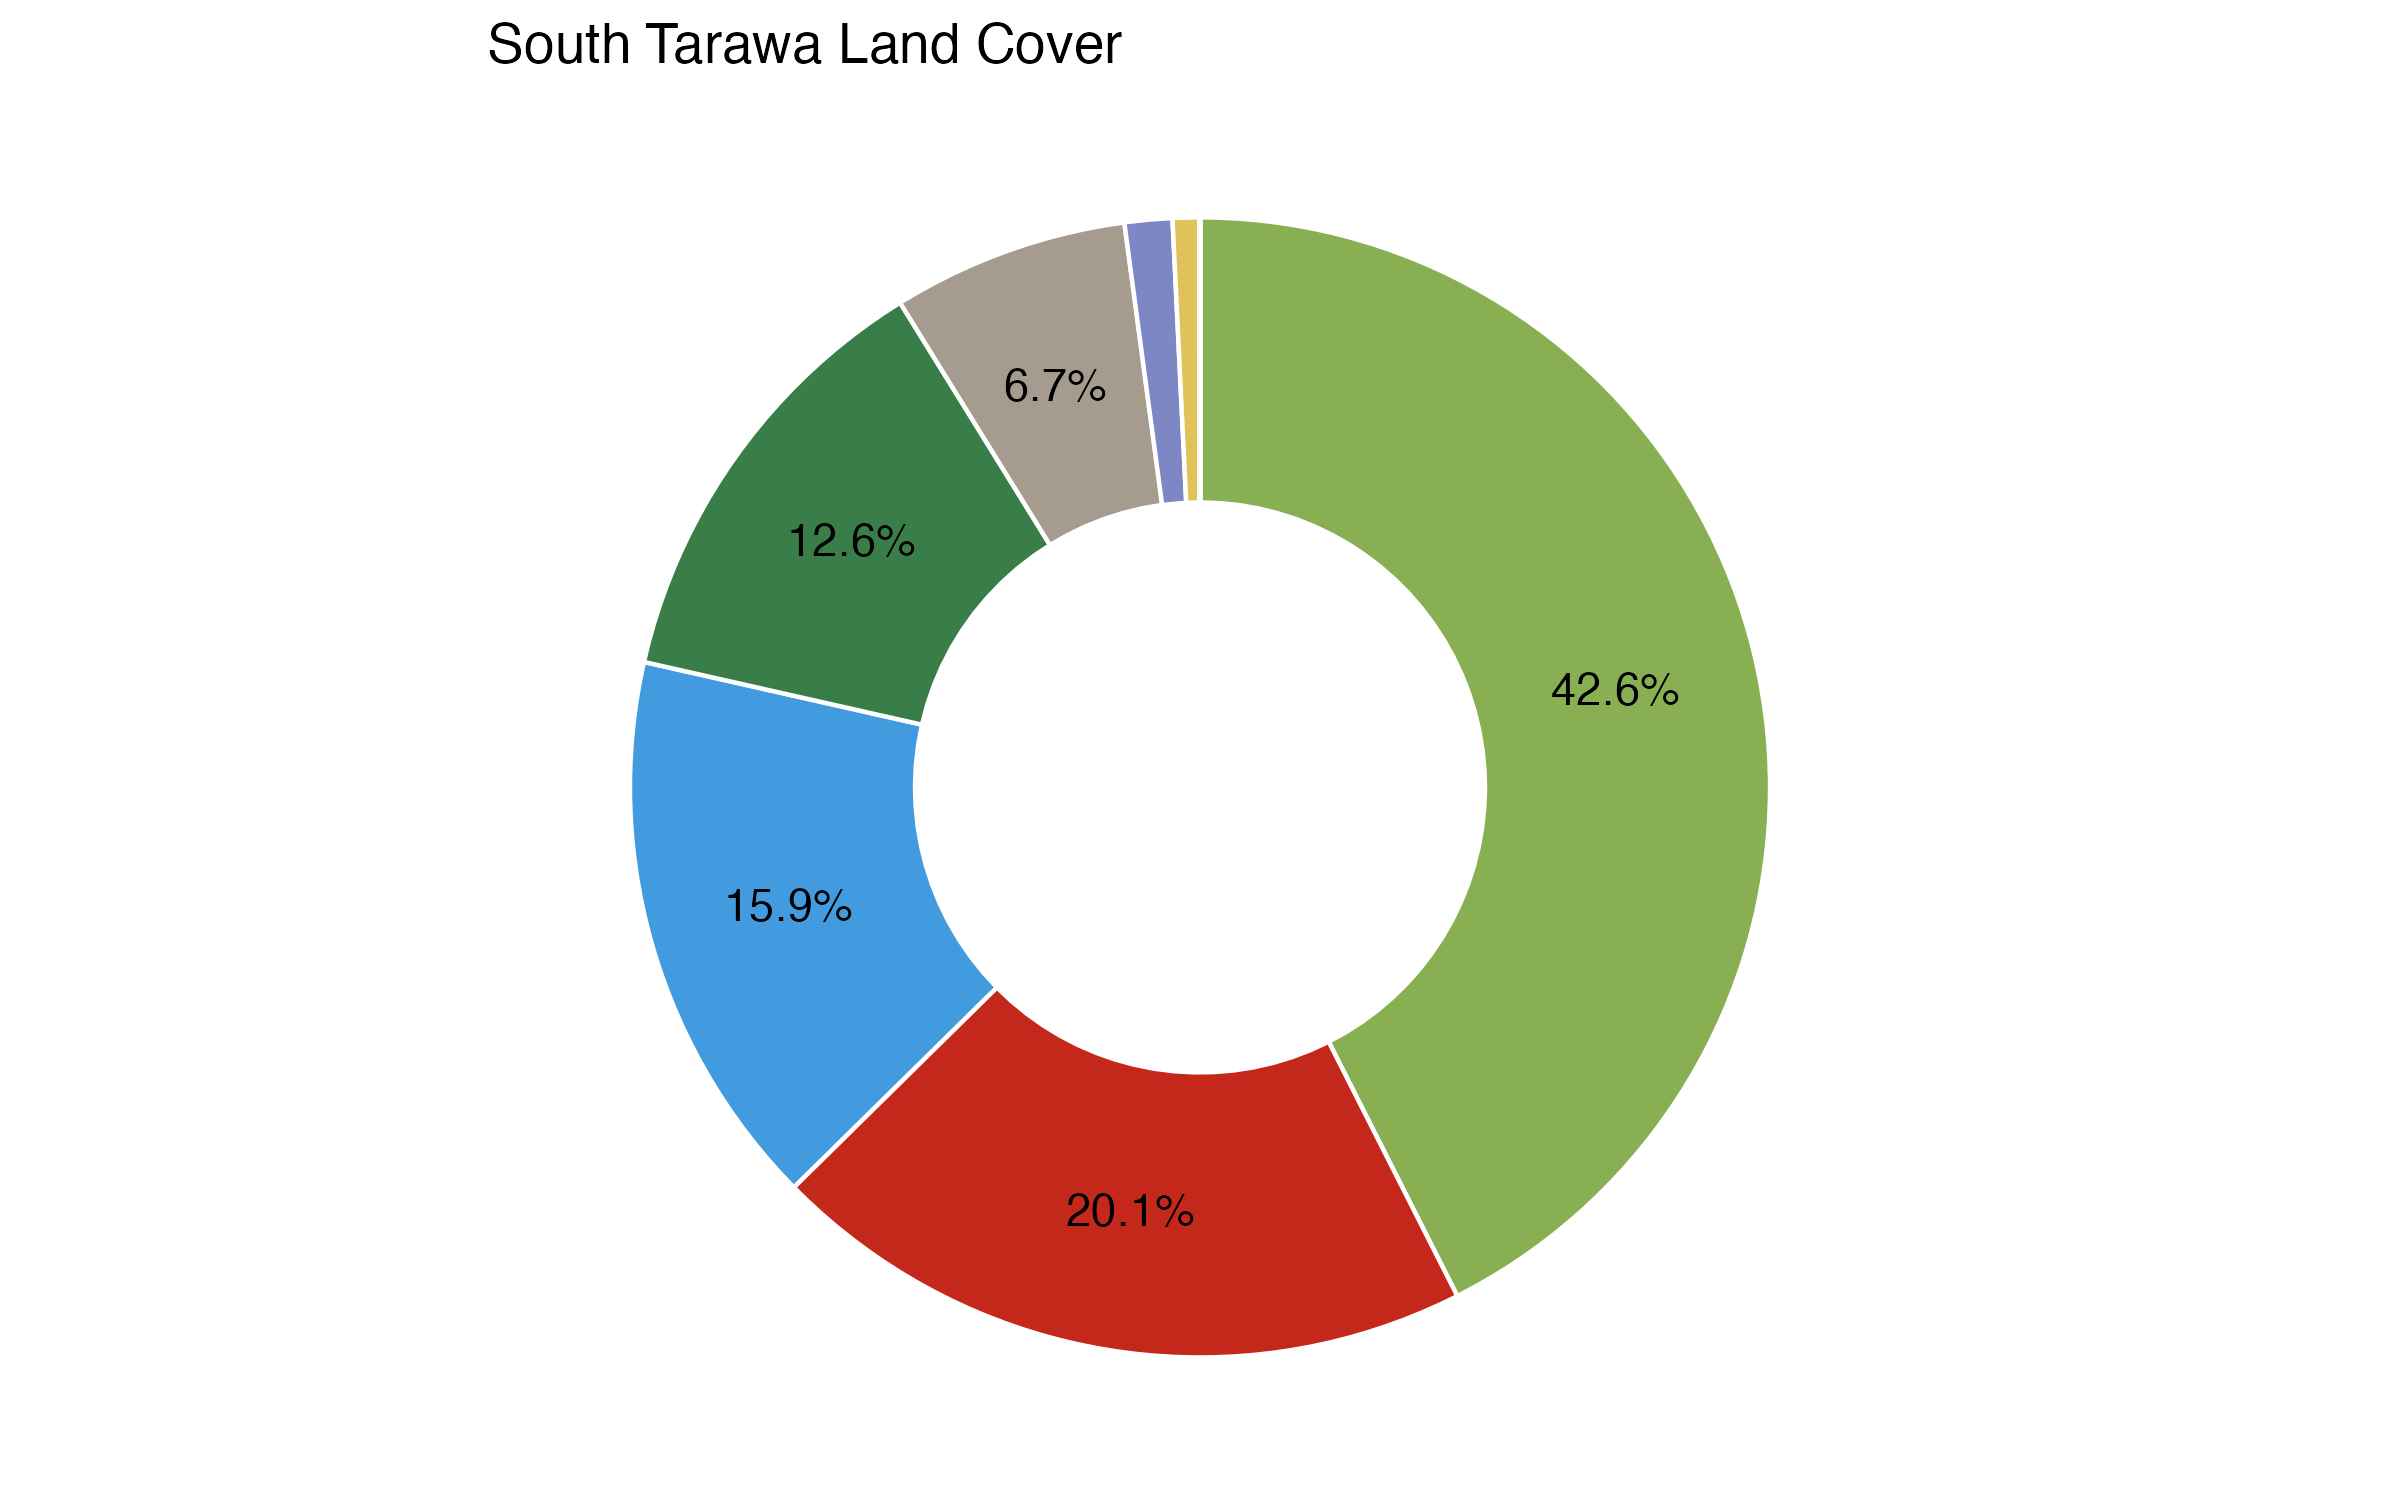
- Grassland is the largest land class and covers 42.6% of all land
- Built-up area is the next largest class, and comprises 20.1% of the land
- The next largest class is permanent water bodies which can be predominantly found in between Banraeba and Eita and in between Bikenibeu and Bonriki
Land cover refers to the ground surface cover, including vegetation, urban infrastructure, water, and bare soil, among other classifications. Identifying land cover type helps to understand land utilization and inform planning policies and programs.
© ESA WorldCover project 2020 / Contains modified Copernicus Sentinel data (2020) processed by ESA WorldCover consortium’
Intersection Density
- Road intersection density appears to generally correlate with South Tarawa’s more populous areas
Intersection density is a measure of network compactness, conveying information about street connectivity. The amount and types of intersections in a road network help determine how a local community functions and the character of the streets themselves. In a good street network, most streets should connect at both ends. A high level of connectivity provides an efficient platform for dispersing traffic, facilitating route choice, and creating more comfortable conditions for people who travel by foot, bike, or transit.
Map data from OpenStreetMap.
Climate Conditions
Solar Photovoltaic Potential
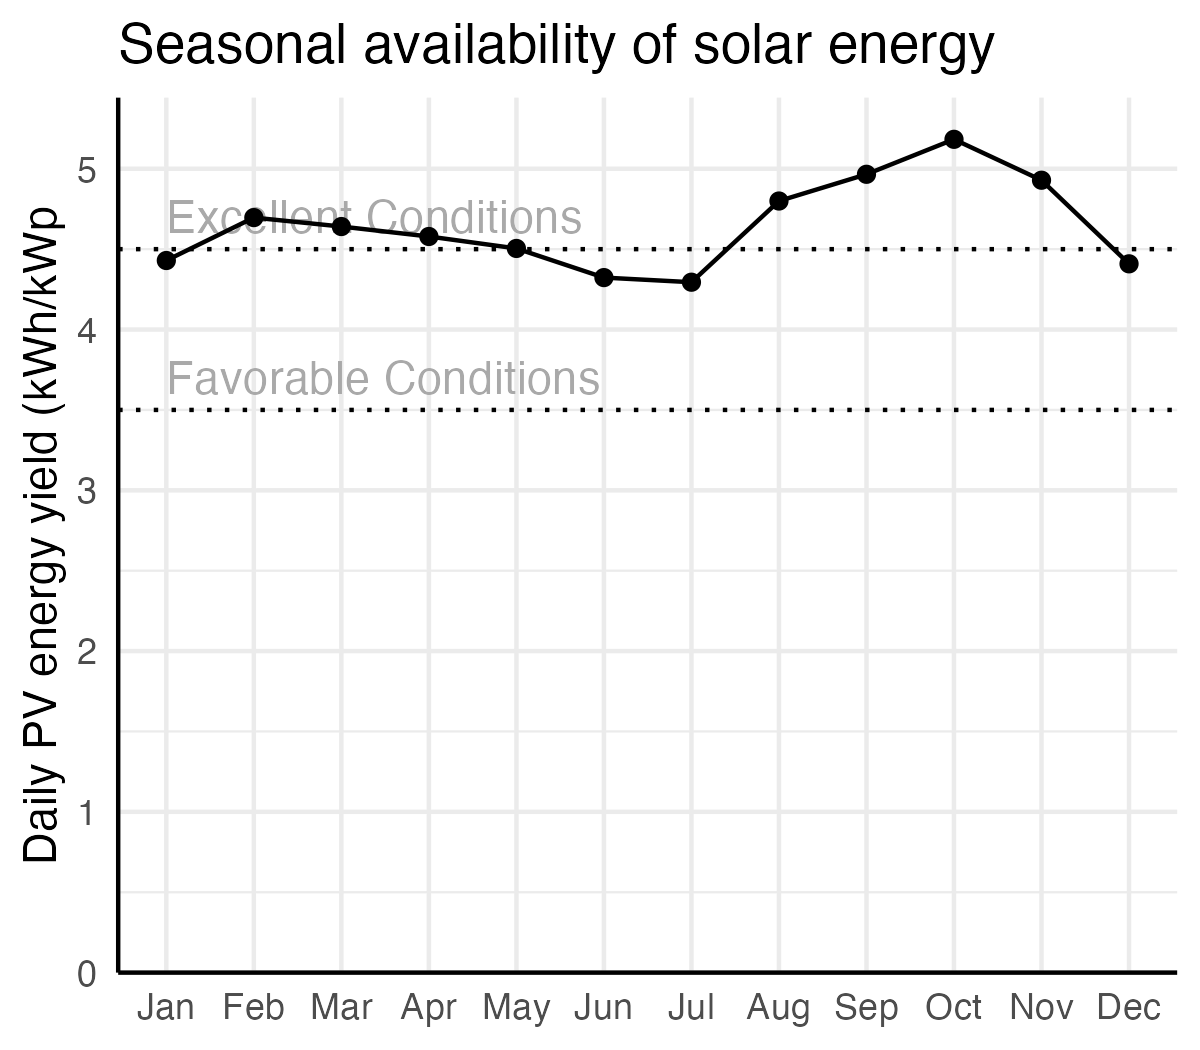
- PV power potential in South Tarawa is excellent throughout, however it is highest in areas in between Betio and Banraeba and in areas in between Bikenibeu and Bonriki
- There is very little seasonality, with slightly higher solar availability from September-November, and a mild decrease from December - February
Solar electricity offers a unique opportunity to achieve long-term energy sustainability goals. Photovoltaics (PV) is the most widely applied and versatile technology for solar power. The availability of solar energy depends on site conditions. This map displays an indicative estimate of daily specific yield, that is, how much energy a hypothetical PV system would produce for per unit of capacity (kWh/kWp). Values above 4.5 are considered excellent availability, while values between 3.5 and 4.5 are moderate.
Map data obtained from the “Global Solar Atlas 2.0, a free, web-based application is developed and operated by the company Solargis s.r.o. on behalf of the World Bank Group, utilizing Solargis data, with funding provided by the Energy Sector Management Assistance Program (ESMAP). For additional information: https://globalsolaratlas.info
The Global Solar Atlas uses generalized theoretical settings for a quick assessment of PV power potential for a selected site. An optimum tilt angle of PV modules and 100% availability (no shutdowns due to failure) are assumed.
Vegetated Areas
- South Tarawa is rich in vegetation
- Green space is particularly dense in areas in between Nanikai and Banraeba, in areas in between Eita and Bikenibeu, and on the eastern edge of the area between Bikenibeu and Bonriki
This map displays the Normalized Difference Vegetation Index, which ranges between -1 and 1, with higher numbers indicating a higher density of green vegetation. Values of less than 0.1 typically indicate water, rock, and otherwise barren land; values of 0.1 to 0.3 are associated with shrubs and grassland; 0.3 to 0.5 corresponds to moderate vegetation; and values of more than 0.5 correspond to dense vegetation such as forests or mature crops.
Vegetation and green spaces in cities are associated with health benefits and the mitigation of environmental risks. More green space in a city can reduce temperatures and the urban heat island effect, lessen air pollution, and absorb floodwaters. Green spaces can also serve important civic, social, and quality of life functions.
Map data from European Space Agency, 2020, “Normalized Difference Vegetation Index”.
NDVI-based measures do not account for the proximity and spatial arrangement of green spaces within areal units. They also do not address the vertical dimension and density of green urban buildup.
Risk Identification
Infrastructure Assets Exposed to Rainwater Flooding
- 4.2% of major roads and no schools, health facilities, nor police stations are located in a surface water flood risk zone with a minimum depth of 15 cm
Pluvial, or surface water flooding, is caused when heavy rainfall creates a flood event independent of an overflowing water body. It can occur in any urban area — even higher elevation areas that lie above coastal and river floodplains.
The infrastructure assets shown here are provided by OpenStreetMap. There may be other roads, health facilities, schools, fire stations and police stations that are not cataloged by OpenStreetMap.
Map data from OpenStreetMap and Fathom, “Flood Hazard: Global 2.0”. See Data Notes for more on the Fathom dataset.
OpenStreetMap data may not include all facilities.
Infrastructure Assets Exposed to Coastal Flooding
- 3.7% of major roads and no schools, health facilities, nor police stations are located in a coastal flood risk zone with a minimum depth of 15 cm
Coastal flooding occurs when water inundates or covers normally dry coastal land as a result of high or rising tides or storm surges. Due to the effects of climate change (e.g. sea level rise and an increase in extreme weather events), damage due to coastal flooding has intensified.
The infrastructure assets shown here are provided by OpenStreetMap. There may be other roads, health facilities, schools, fire stations and police stations that are not cataloged by OpenStreetMap.
Map data from OpenStreetMap and Fathom, “Flood Hazard: Global 2.0”. See Data Notes for more on the Fathom dataset.
OpenStreetMap data may not include all facilities.
Infrastructure Assets Exposed to River, Rainwater or Coastal Flooding
- 7.8% of major roads and no schools, health facilities, nor police stations are located in a riverine, surface water, or coastal flood risk zone with a minimum depth of 15 cm
Many urban areas experience both fluvial and pluvial floods; places near rivers are preferred settlement areas, and a predominantly sealed urban surface prevents water infiltration, facilitating surface inundation. This problem is exacerbated in cities with insufficient or non-existent sewer systems.
The infrastructure assets shown here are provided by OpenStreetMap. There may be other roads, health facilities, schools, fire stations and police stations that are not cataloged by OpenStreetMap.
Map data from OpenStreetMap and Fathom, “Flood Hazard: Global 2.0”. See Data Notes for more on the Fathom dataset.
OpenStreetMap data may not include all facilities.
Population Exposed to Rainwater Flooding
- 10% of South Tarawa’s more populous areas (areas with more than 300 people per hectare) are within the surface water flood risk zone with a minimum depth of 15 cm
One consequence of increased population density in cities is an increase in impermeable surfaces, which leads to an increase in storm-water runoff.
Map data from WorldPop and Fathom. See Data Notes for more on the Fathom dataset.
Population Exposed to Coastal Flooding
- 0.7% of South Tarawa’s more populous areas (areas with more than 300 people per hectare) are within the coastal flood risk zone with a minimum depth of 15 cm
Coastal flooding significantly impacts coastal communities by causing displacement, property damage, and economic loss, disrupting daily life and local economies. Additionally, it exacerbates health risks, undermines infrastructure, and leads to biodiversity loss and ecosystem damage, further intensifying long-term social and environmental challenges.
Map data from WorldPop and Fathom. See Data Notes for more on the Fathom dataset.
Population Exposed to River, Rainwater or Coastal Flooding
- 10.7% of South Tarawa’s more populous areas (areas with more than 300 people per hectare) are within the riverine, surface water, or coastal flood risk zone with a minimum depth of 15 cm
When populations are exposed, vulnerable, dense, and ill-prepared, the effects of climate change on them are exacerbated along with the increased intensity and frequency of harmful flood events.
Map data from WorldPop and Fathom. See Data Notes for more on the Fathom dataset.
Elevation
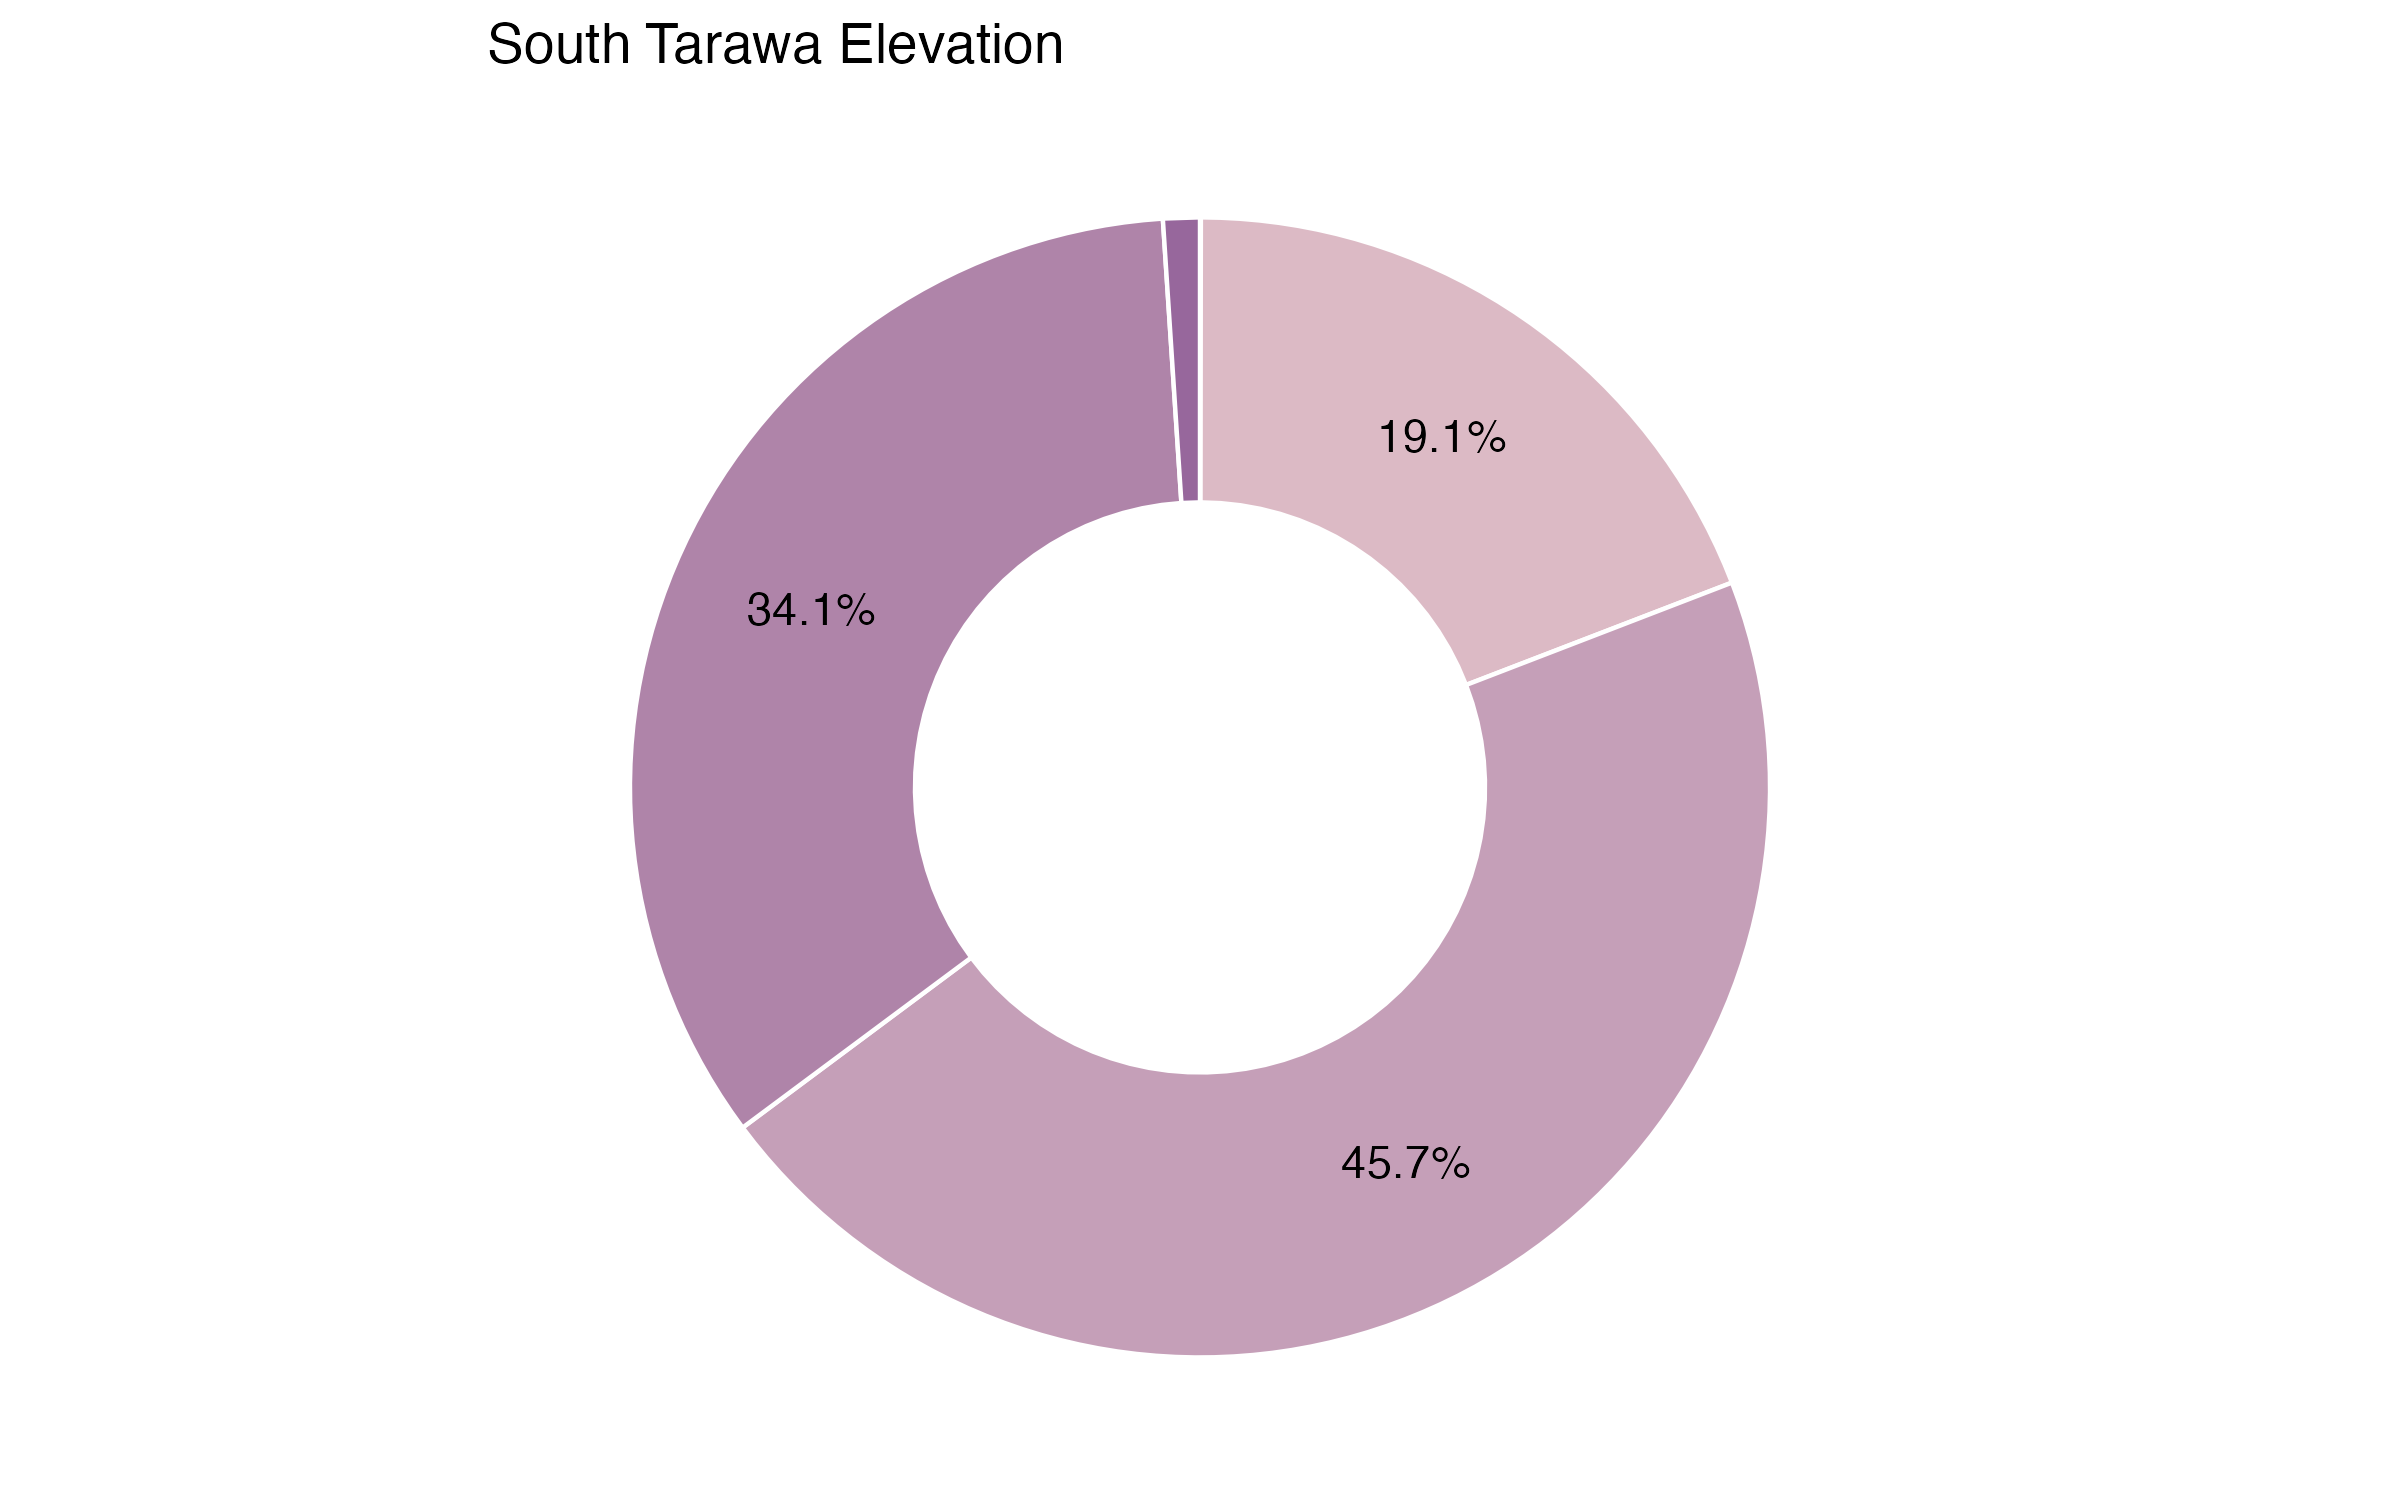
- South Tarawa’s topography is extremely flat, with about half of the area having an elevation of only 0-5 meters above sea level (MASL)
- The highest points in South Tarawa reach just 15-20 MASL, primarily in the Bonriki area
Elevation informs an area’s vulnerability to many natural disasters. The height at which infrastructure, resources, and communities sit relative to normal water levels and tides, flood waters, and storm surges and waves informs their exposure. Elevation information is critical for communities to anticipate the impacts of disasters and to prepare resilient and cost-effective response and redevelopment strategies.
Map data from FABDEM V1-2.
Slope
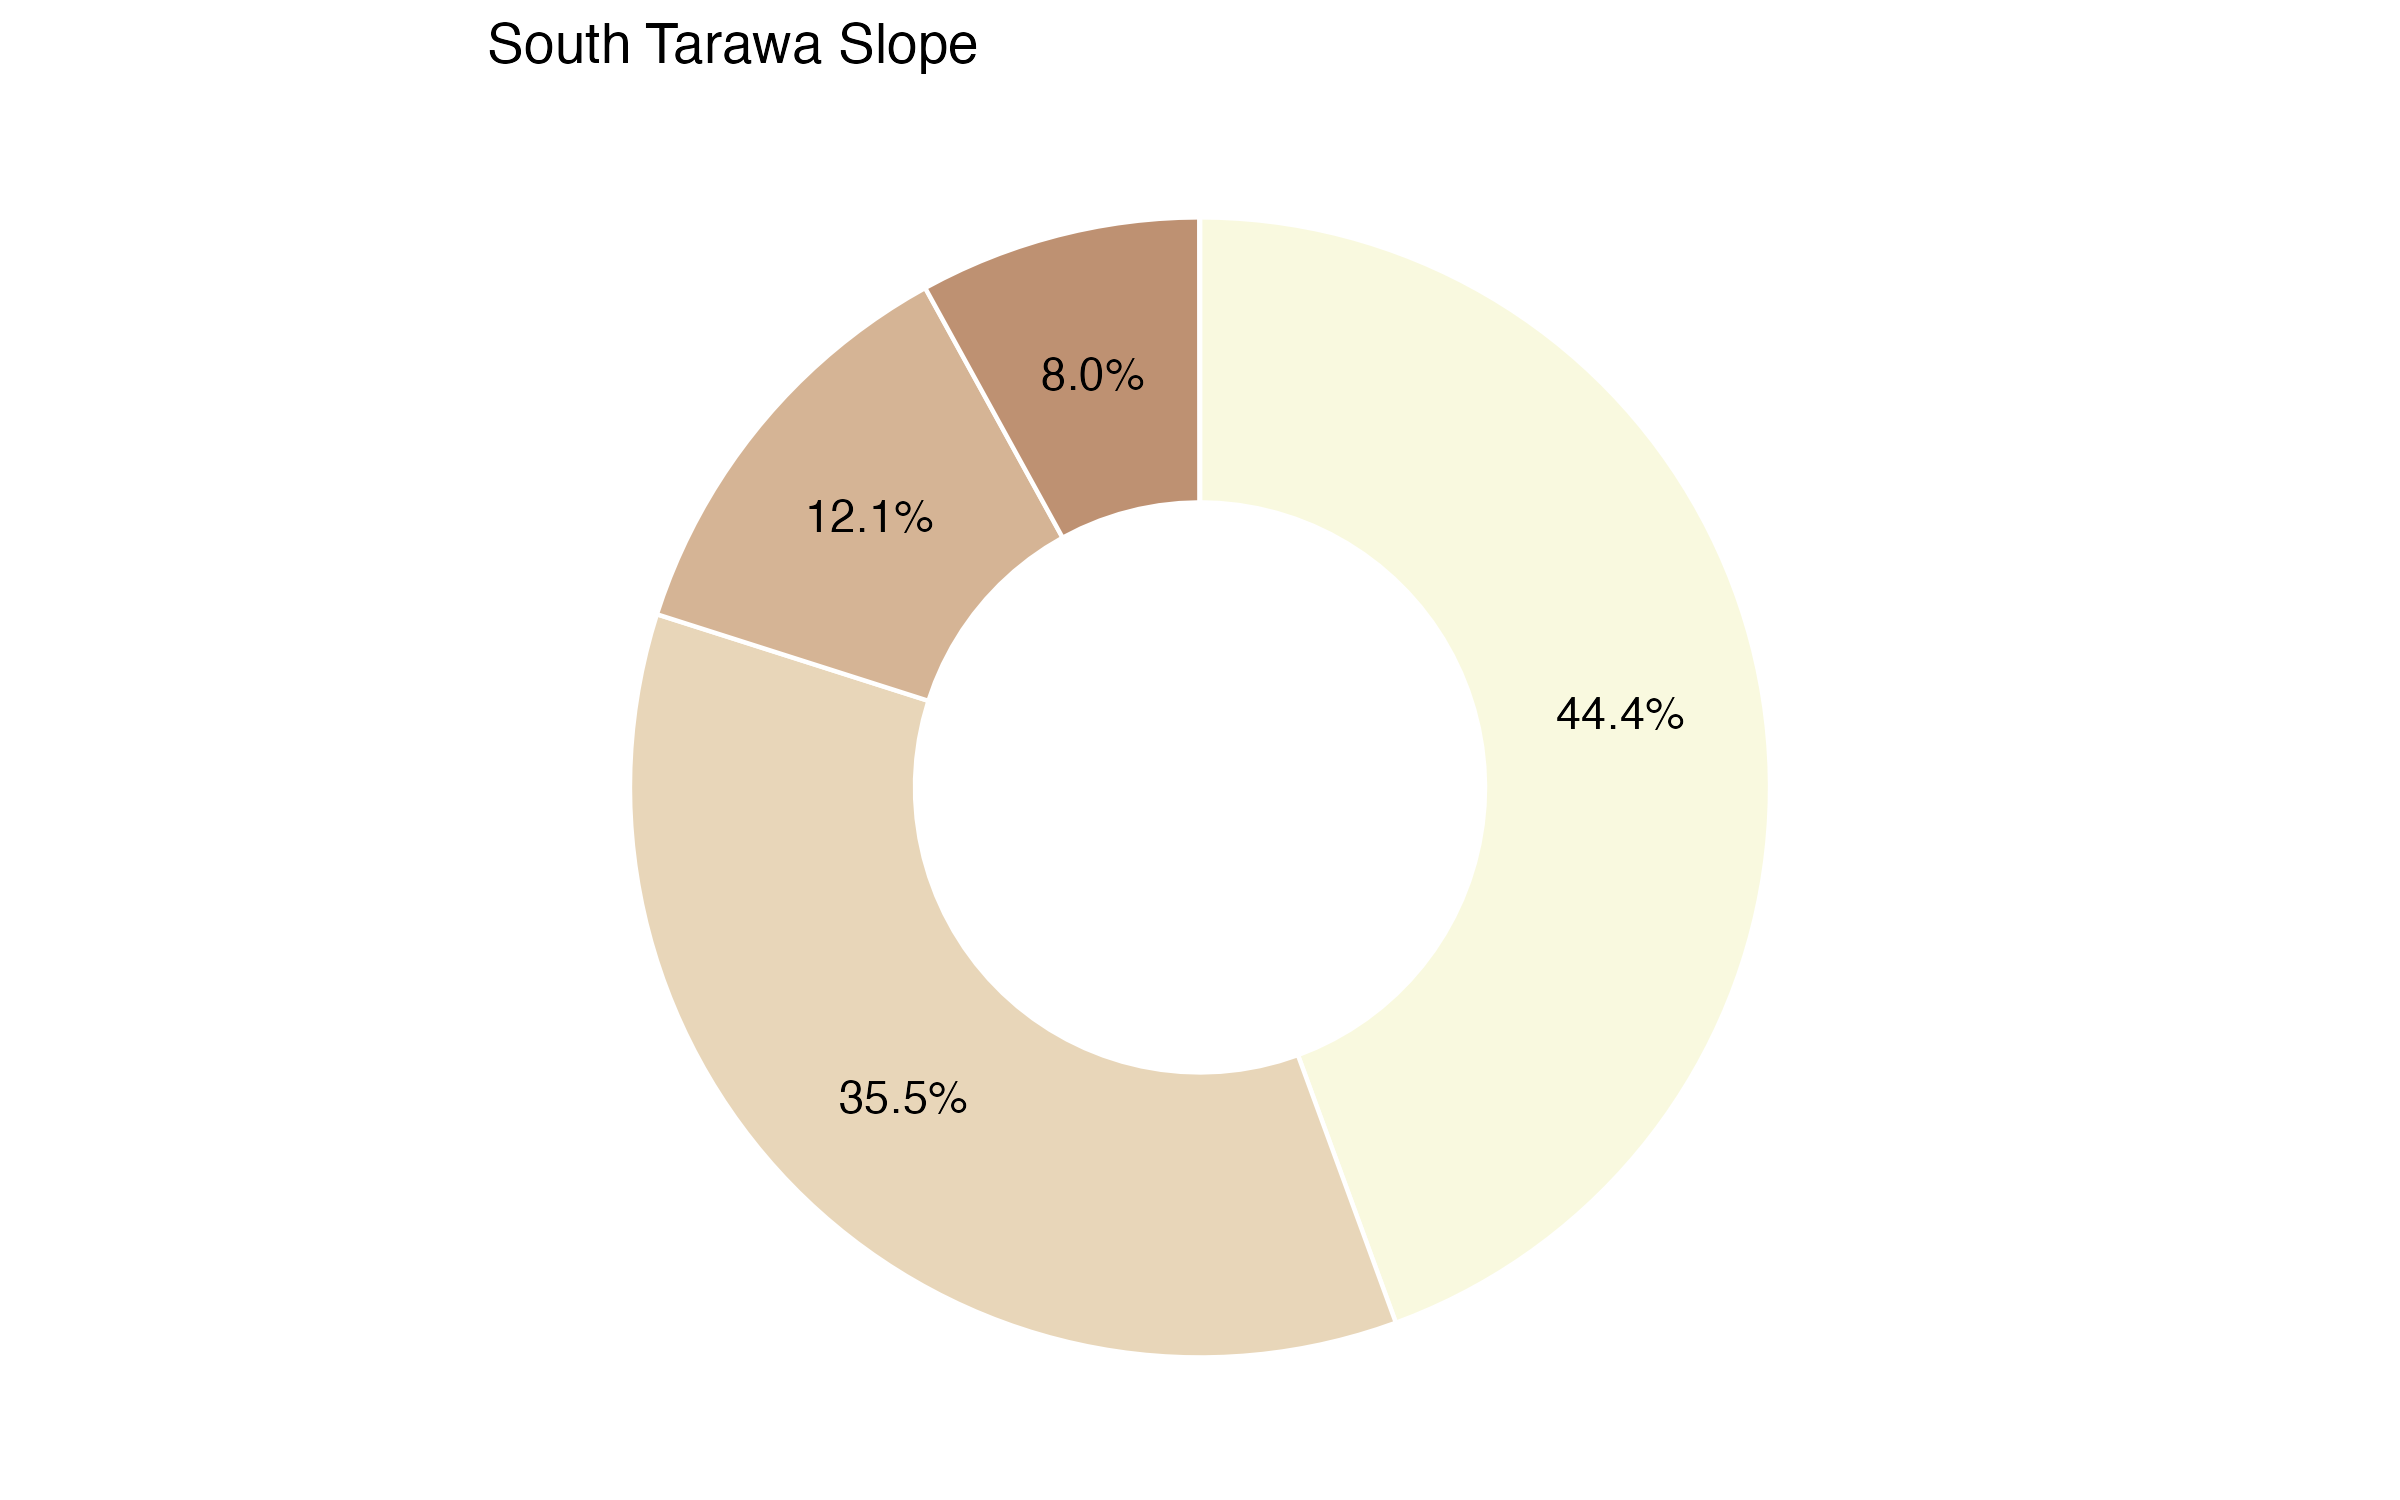
- South Tarawa is extremely flat and roughly 80% of the area has a slope of less than 5° (8.75% grade)
- In the Bonriki area, there is slightly more topographic variation
- In general, South Tarawa’s extremely low elevation, combined with its minimal slope, could render water management difficult
Slope refers to the percentage change in elevation over a certain distance. In hilly or mountainous areas, floods can occur within minutes after heavy rains, while in flat areas, floodwaters can remain for days. Considering the slope of land is important in reducing construction costs, extending services and public facilities, minimizing the risks of hazards like flooding and landslides, and mitigating the impacts of development on natural resources.
Map data from USGS, 2015, “USGS EROS Archive - Digital Elevation”.
Landslides
- Landslide susceptibility is very low throughout all of South Tarawa
This indicator refers to the likelihood that a landslide will occur in a particular area based on local terrain conditions. It shows the degree to which a terrain can be affected by slope movements, i.e., an estimate of “where” landslides are likely to occur. Susceptibility does not, however, consider the temporal probability of failure (i.e., when or how frequently landslides occur), nor the magnitude of the expected landslide (i.e., how large or destructive the failure will be).
This map combines satellite observations of rainfall with an assessment of the underlying susceptibility of the terrain. Steep slopes are the most important factor in a landscape’s susceptibility to landslides. Others include deforestation, presence of roads, strength of the bedrock and soils, and location of fault lines.
Map data from NASA, “Landslide Susceptibility Map”.
Liquefaction
- South Tarawa appears to have very low susceptibility to liquefaction
While all of the city has the same likelihood of seismic activity, areas within a city will typically have differing levels of vulnerability, due to factors such as soil and building construction. Liquefaction is a phenomenon where loosely packed or waterlogged sediments, particularly beneath buildings and under structures, lose their strength in response to strong ground shaking. Liquefaction in the event of an earthquake can cause increased damages.
This map calculates the likelihood of liquefaction using a combination of indicators such as peak ground velocity, precipitation and others. Each level determines a threshold of confidence regarding the probability of liquefaction in the particular pixel area.
Map data from Zorn & Koks, 2019.
roads
- The road segment that runs east-west and connects Eita to Nanikai is the longest most critical road
- An additional, albeit shorter, critical road segment in the east-west direction exists between Bikenibeu and Eita
- In the north-south direction between Bonriki and Bikenibeu, a small portion of critical road exists at the southern segment, closest to Bikenibeu
- Traffic congestion, due to high private vehicle use, increases vulnerability of critical road segments and could exacerbate disruption impacts when these segments are blocked or damage
This layer visualizes an approximation of road network criticality. It highlights segments within a road network that, if blocked due to flooding or other hazards, would cause a high degree of disruption to travel across the city. Segments in red are the most critical for the overall connectivity of the city.
Note that cities vary substantially in their probability of disruption due to failure of a small number of road segments; for example, when a street network follows a grid pattern or has many alternative routes between destinations, the risk of disruption owing to the failure of key road segments is lower. In contrast, other cities have particular road segments whose failure would affect a large proportion of journeys across the city.
Map data from OpenStreetMap.
Criticality is measured by calculating betweenness for each segment. Betweenness for a segment is calculated by mapping the shortest path from each intersection to every other intersection, and then taking the percentage of all trips that use that segment.
Burnable Area
- South Tarawa’s vegetated areas, comprised mostly of grassland, are bunrbale land cover
- Burnable land cover types are present around Betio, Bairiki, and in the area between Bikenibeu and Bonriki
- The presence of highly burnable land cover types indicates increased susceptibility to a wildfire
This layer visualizes the burnability factor of each land cover classification, based on assigning a binned weighting factor to represent burnability of each land classification. As per Four Twenty Seven’s research and Gannon and Steinberg’s (2021) research, global trends in historical wildfire intensity and occurrence of wildfire in each land cover classification is converted into a single burnability factor.
© ESA Land Cover CCI 2020/ Gannon et.al 2021
Local Institutions & Planning
Administrative Structure
- South Tarawa is comprised of two urban councils - Betio Town Council and Teinainano Urban Council
- Each council is governed by a local councillor who is elected via a first-past-the-post vote that is held every four years
- The councillor is responsible for the local governance of their council, providing various services such as education, healthcare, public sanitation, transportation, water supply, and economic regulation
- At the national level, the Kiribati Local Government Association (KILGA) represents the interests of all councils
Availability Of Development Plans And Policies
- The 2013 Kiribati Integrated Environment Policy (KIEP) is a critical strategic policy document that emphasizes environmental resilience and climate change
- Recognizing the need to scale up renewable energy efficiency, the Kiribati Integrated Energy Roadmap: 2017-2025 was proposed in 2015
- The National Quality Policy of Kiribati 2017-2023 was developed by the Ministry of Commerce, Industry and Cooperatives (MCIC) with the intention to support sustainable development
- Encompassing all aforementioned aspects of resilience, infrastructure, and sustainable development Kiribati Development Plan 2020-2023 focus on six key priority areas: (i) harnessing our Human Health; (ii) Growing our Economic Wealth and Leaving No-One Behind; (iii) Improving our Health; (iv) Protecting our Environment and Strengthening Resilience; (v) Good Governance; and (vi) Developing our Infrastructure
The State of Urban Infrastructure and Service Delivery
Land Administration
Kiribati’s land administration system operates through the South Tarawa-based Land Management Division (LMD). The LMD is organized into four departments with primary focus on managing government-owned lands (i.e., state lands) and leasehold lands. Legal frameworks that govern land administration include the: (i) Native Land Ordinance (Cap61), which maintains duplicate land registers and establishes surveying powers; (ii) Rent Review Ordinance (Cap90), which provides for triennial rental reviews; (iii) Foreshore and Land Reclamation Ordinance (Cap35), which governs coastal developments; (iv) Land Planning Ordinance (Cap48), which establishes planning provisions; and (v) State Land Act 2001, which regulates state lands in the Line and Phoenix Islands. The LMD maintains the computerized Kiribati Land Information System (KLIS) as the official land register, ensuring proper planning and utilization of government lands throughout the nation.
Energy
In 2021, the global average energy consumption was 20.9 MWh per person, while in Kiribati it was only 2.5 KWh per person. 2022 estimates determine that about 94% of the country’s population has access to electricity. On the Tarawa atoll specifically, electrical energy from fossil fuels and petroleum energy sources make up most of the energy supply. In order to improve energy security, reduce vulnerability, and mitigate against further environmental degradation, the Government of Kiribati has acknowledged a need to shift away from diesel fuel use and towards renewable energy systems. Development partners such as the Asian Development Bank (ADB), European Union (EU), Government of Australia, Government of Japan, Government of New Zealand, Government of United Arab Emirates, International Monetary Fund (IMF), United Nations (UN), and the World Bank have supported the country in planning and financing of renewable energy sector investments that align with the recommendations proposed in the Kiribati Integrated Energy Roadmap: 2017-2025 and that are in line with the Paris Agreement.
Housing
South Tarawa is grappling with several housing challenges driven by urbanization, demographic pressures, and climate change. In South Tarawa, much of the housing stock is in poor condition, and it is not climate-resilient. There is also insufficient housing supply to meet the growing demand that is caused by population growth and increasing rural to urban migration. Additionally, many households face constraints on housing affordability due to low income levels. As a result, the number and size of informal settlements is increasing in South Tarawa. In order to improve current living conditions for the city’s residents, there is an urgent need for affordable and climate-resilient housing solutions.
Disaster Risk Management
Kiribati is amongst the most vulnerable nations in the world to climate change, with a range of natural hazards, such as sea-level rise, coastal flooding, tsunamis, extreme heat, and cyclones. Nearly the entire population of Kiribati resides in low-lying coastal areas, exposing both infrastructure and communities to risks like king tides and sea level rise. As climate change continues to impact weather patterns, the frequency and severity of these events are expected to increase, posing additional threats and compounding challenges for resilience. In 2012 the government put forth a National Disaster Risk Management Plan, providing a framework for effective disaster planning and execution that simultaneously champions sustainable development. At the national level, this disaster risk management (DRM) is primarily coordinated by the principal executing body, the National Disaster Risk Management Council (NDRMC). At the local level, however, the National Disaster Risk Management Office (NDRMO) reviews local DRM arrangements and advises the NDRMC accordingly.
Drinking Water Supply
According to UN-Water, while 80% of the Kiribati population had access to basic water sources in 2022, it is estimated that only 14% of the population had access to water supply that meets the global standard for “safely managed”. Water supply for 95% of South Tarawa’s population is sourced via a combination of rainwater, wells, and the Public Utilities Board (PUB). Reduced rainwater and well salt water contamination from rising sea levels pose further risk to this already strained system. In addition to these climate change induced threats, rapid urbanization and centralization in South Tarawa due to migratory patterns into the city further strain limited water resources, increasing the risk of water insecurity. Overcrowding in South Tarawa has led to groundwater contamination and waterborne illnesses, such as tuberculosis. Organizations like the ADB, EU, ChildFund Alliance, Plan International Australia, Live & Learn Environmental Education, and United Nations International Children’s Emergency Fund (UNICEF) have funded and implemented a variety of projects aimed to improve access to clean drinking water in the country. Focused on ensuring safe, adequate, and sustainable water services, the government has also proposed a Kiribati National Water Resource Policy (NWRP). Despite these efforts, ongoing challenges remain.
Urban Roads & Transport
Transportation networks in Kiribati are limited by geography. While the country has 670 kilometers of highways, only 27 kilometers of the road network, all of which is located in South Tarawa, is paved. Private minibuses are the main form of public transportation, and water taxis also exist. In addition to public transportation, the local population also relies on private motorbikes, cars, and small trucks. The limited road network, limited public transportation options, and relatively high private vehicle use in South Tarawa has led to traffic congestion throughout the area. The nation does not have a railway system. South Tarawa hosts the country’s main marine port, Betio Port, and the country’s international airport, Bonriki International Airport.
Solid Waste Management
There is limited data on solid waste management in South Tarawa. Despite this, an estimated 19 tons of waste per day is generated in the city. 75% of such waste is believed to be organic materials, such as garden waste and palm/pandanus fronds. Weekly waste collection services are provided by the municipal councils - Betio Town Council (BTC) and TeInainano Urban Council (TUC). Private weekly waste collection services are also offered by a New Zealand Urban Development Program pilot project. The collected solid waste is disposed of in Nanikai, Bikenibeu, and Betio landfills. While waste management and collection systems are in place, it is estimated that only 38% of all generated waste is managed by official authorities. The remaining waste is often managed on-site or illegally dumped into the sea. While daily waste management is the responsibility of the municipal councils, overall solid waste management policy and planning is a national government responsibility. In 2007, and in an effort to guide national solid waste management, the Ministry of Environment, Lands and Agriculture Development (MELAD), in partnership with the South Pacific Regional Environmental Programme (SPREP), drafted the National Solid Waste Management Strategy.
Local Administration
Kiribati is a unitary republic with a two-tier government system comprising national and local levels. Local government is enshrined in the constitution and governed by the Local Government Act 1984 (amended 2006). The Minister of Internal and Social Affairs oversees the local government, which consists of 26 councils made up of three town (urban) councils and 23 island (rural) councils. The three urban councils consist of the Kiritimati Island Urban Council, Betio Town Council, and Teinainano Urban Council, while island councils are established on all inhabited islands. Councils provide various services, including education, healthcare, public sanitation, transportation, water supply, and economic regulation. Local elections occur every four years with councillors elected through a first-past-the-post voting system. Established in 2012, the Kiribati Local Government Association (KILGA) represents the interests of all councils at the national level.
Land Administration: MELAD (2025). Housing: ADB (2013); ADB (2020); UNDRR (2019). Energy: ADB (2020); CIF (n.d.); Ritchie (2025); Worldometer (2025). Disaster Risk Management: GFDRR (2025); Republic of Kiribati (2012); UNDRR (2019); World Bank (2025). Water: EEAS (2020); Live & Learn Environmental Education (2022); ReliefWeb (2023); UN-Water (2025); USP (2025). Urban Roads and Transport: iExplore (2025); USP (2024); Wikipedia (2025, January); Wikipedia (2025b, February); World Ports Directory (2025). Solid Waste Management: ADB (2014). Local Administration: CLGF (n.d.); Commonwealth Governance (2024); Wikipedia (2025a, February)
Key Considerations for Investment Planning & Prioritization
Concluding Questions
What is the most surprising result for you in this City Scan?
What patterns did this City Scan illuminate that you had not considered before?
What are your city’s critical development challenges?
What other information would you like in order to corroborate or amplify the information in this City Scan?
Who else would you like to speak with to gain further understanding about your city’s development challenges?
What investments need to be prioritized? What trade-offs are inherent in your prioritization?
What investments could be coordinated? What benefits would such coordination bring?