Kolonia, Federated States of Micronesia
Kolonia, Federated States of Micronesia
City Scan
May 2025
![]()
![]()
![]()
![]()
Executive Summary
Setting the Context
Kolonia is the capital of Pohnpei State, and sits on the northern coast of Pohnpei Island, which is the largest and most populous island of the Federated States of Micronesia (FSM). Palikir, which also falls within this scan’s area of interest, replaced Kolonia as the capital of FSM in 1989, and is located to Kolonia’s inland southwest. Kolonia’s economy is primarily driven by government services, education, and healthcare.
Population and Demographic Trends
Kolonia’s population grew by 10% from 5,500 in 1980 to 6,100 in 2010, though it’s population dropped in 2000 accounting. Kolonia is the second most population dense of the five Pacific cities considered in this analysis (Honiara, Kolonia, Funafuti, Port Moresby, and Apia, in order of density). Density is highest in northwestern Kolonia, though there are also settlements of higher density along the road connecting Kolonia to Palikir.
City Competitiveness and Economic Activity
Economic activity appears greatest in the town of Kolonia and on the island of Dekehtik, though it appears to be declining in these areas.
Built Form
Kolonia’s area is largely wooded, with trees or mangroves covering almost three-quarters of the area. Another about 10% of the land consists of built-up area and grassland, each. Road connectivity is high in the town of Kolonia, while there are few roads in Palikir. Along this network, most of the area is within a 1.6-km journey to a school.
Climate Conditions
Solar energy is moderately but consistently available in Kolonia, with the greatest availability near the airport and in February and August. Where data is available, air quality is good and meets the WHO’s safety standard. Surface temperatures are relatively cool, with higher temperatures in Kolonia and at the airport, while inland Palikir is cooler.
Risk Identification
Sea level rise and cyclones are great risks to coastal Kolonia. Risk to earthquakes, landslides, and riverine flooding appear negligible. Coastal flooding, however, threatens much of Dekehtik Island and significant portions of Kolonia’s coast, under both moderate and extreme global greenhouse gas emission scenarios. The area is also exposed to rainwater flooding.
Local Institutions and Planning
Kolonia is the capital of Pohnpei State, which is one of four states in FSM, while Palikir is the federal capital. Kolonia is governed by the Kolonia Town Government, which is responsible for the city’s administration and development, though the state government holds significant authority. FSM has a medium-term development strategic plan that is coming to an end in 2023, and a short-term infrastructure plan for 2016–2025.Setting the Context
Basic City Information
Kolonia is the capital city of Pohnpei State, which is the largest state in the Federated States of Micronesia (FSM). Kolonia was the capital of FSM until 1989, when it was replaced by Palikir, which is also within the area of analysis. Situated in the western Pacific Ocean, FSM is made up ll islands scattered across the Pacific.
Geographically, Kolonia is nestled on the northeastern coast of Pohnpei Island and is characterized by a diverse tropical landscape consisting of mountains and rainforests. The city is surrounded by mangrove swamps and is known for its stunning natural beauty.
As the capital city, Kolonia serves as the political, economic, and cultural center of Pohnpei State. As such, the local economy of Kolonia is primarily driven by government services, including administration, education, and healthcare.
The FSM National Government offices are located in Kolonia, providing employment for some two-thirds of the adult working population. The city also houses various state government agencies, further contributing to its administrative importance.
Beyond government services, Kolonia reaps the benefits of tourism due to the island’s rich cultural heritage and natural attractions. Nevertheless, economic activities on the island are predominantly centered around subsistence farming, fishing, and small-scale businesses. While Kolonia’s economy has multiple sectors, it is still a relatively small and localized economy within the broader context of Micronesia.
The boundary lines mark the area of interest for the City Scan. These lines may differ from the city’s official administrative boundaries and may include multiple jurisdictions.
Population and Demographic Trends
Population Density
- Population density is highest in the north, on the coast of the mainland
- The densest areas here have 75–89 people per 10,000 m2
- Areas along Circle Island Road, which connects Kolonia and Palikir, and Dekehtik Island have 13–30 people per 10,000 m2, with a few areas having as many people as 45 people 10,000 m2
This map estimates population numbers per 10,000 m2 grid cell. It provides a more consistent representation of population distributions across different landscapes than administrative unit counts. Knowing where people are is critical for impact assessments and intervention plans, especially those focused on service delivery, food security, climate change, network systems and natural disasters.
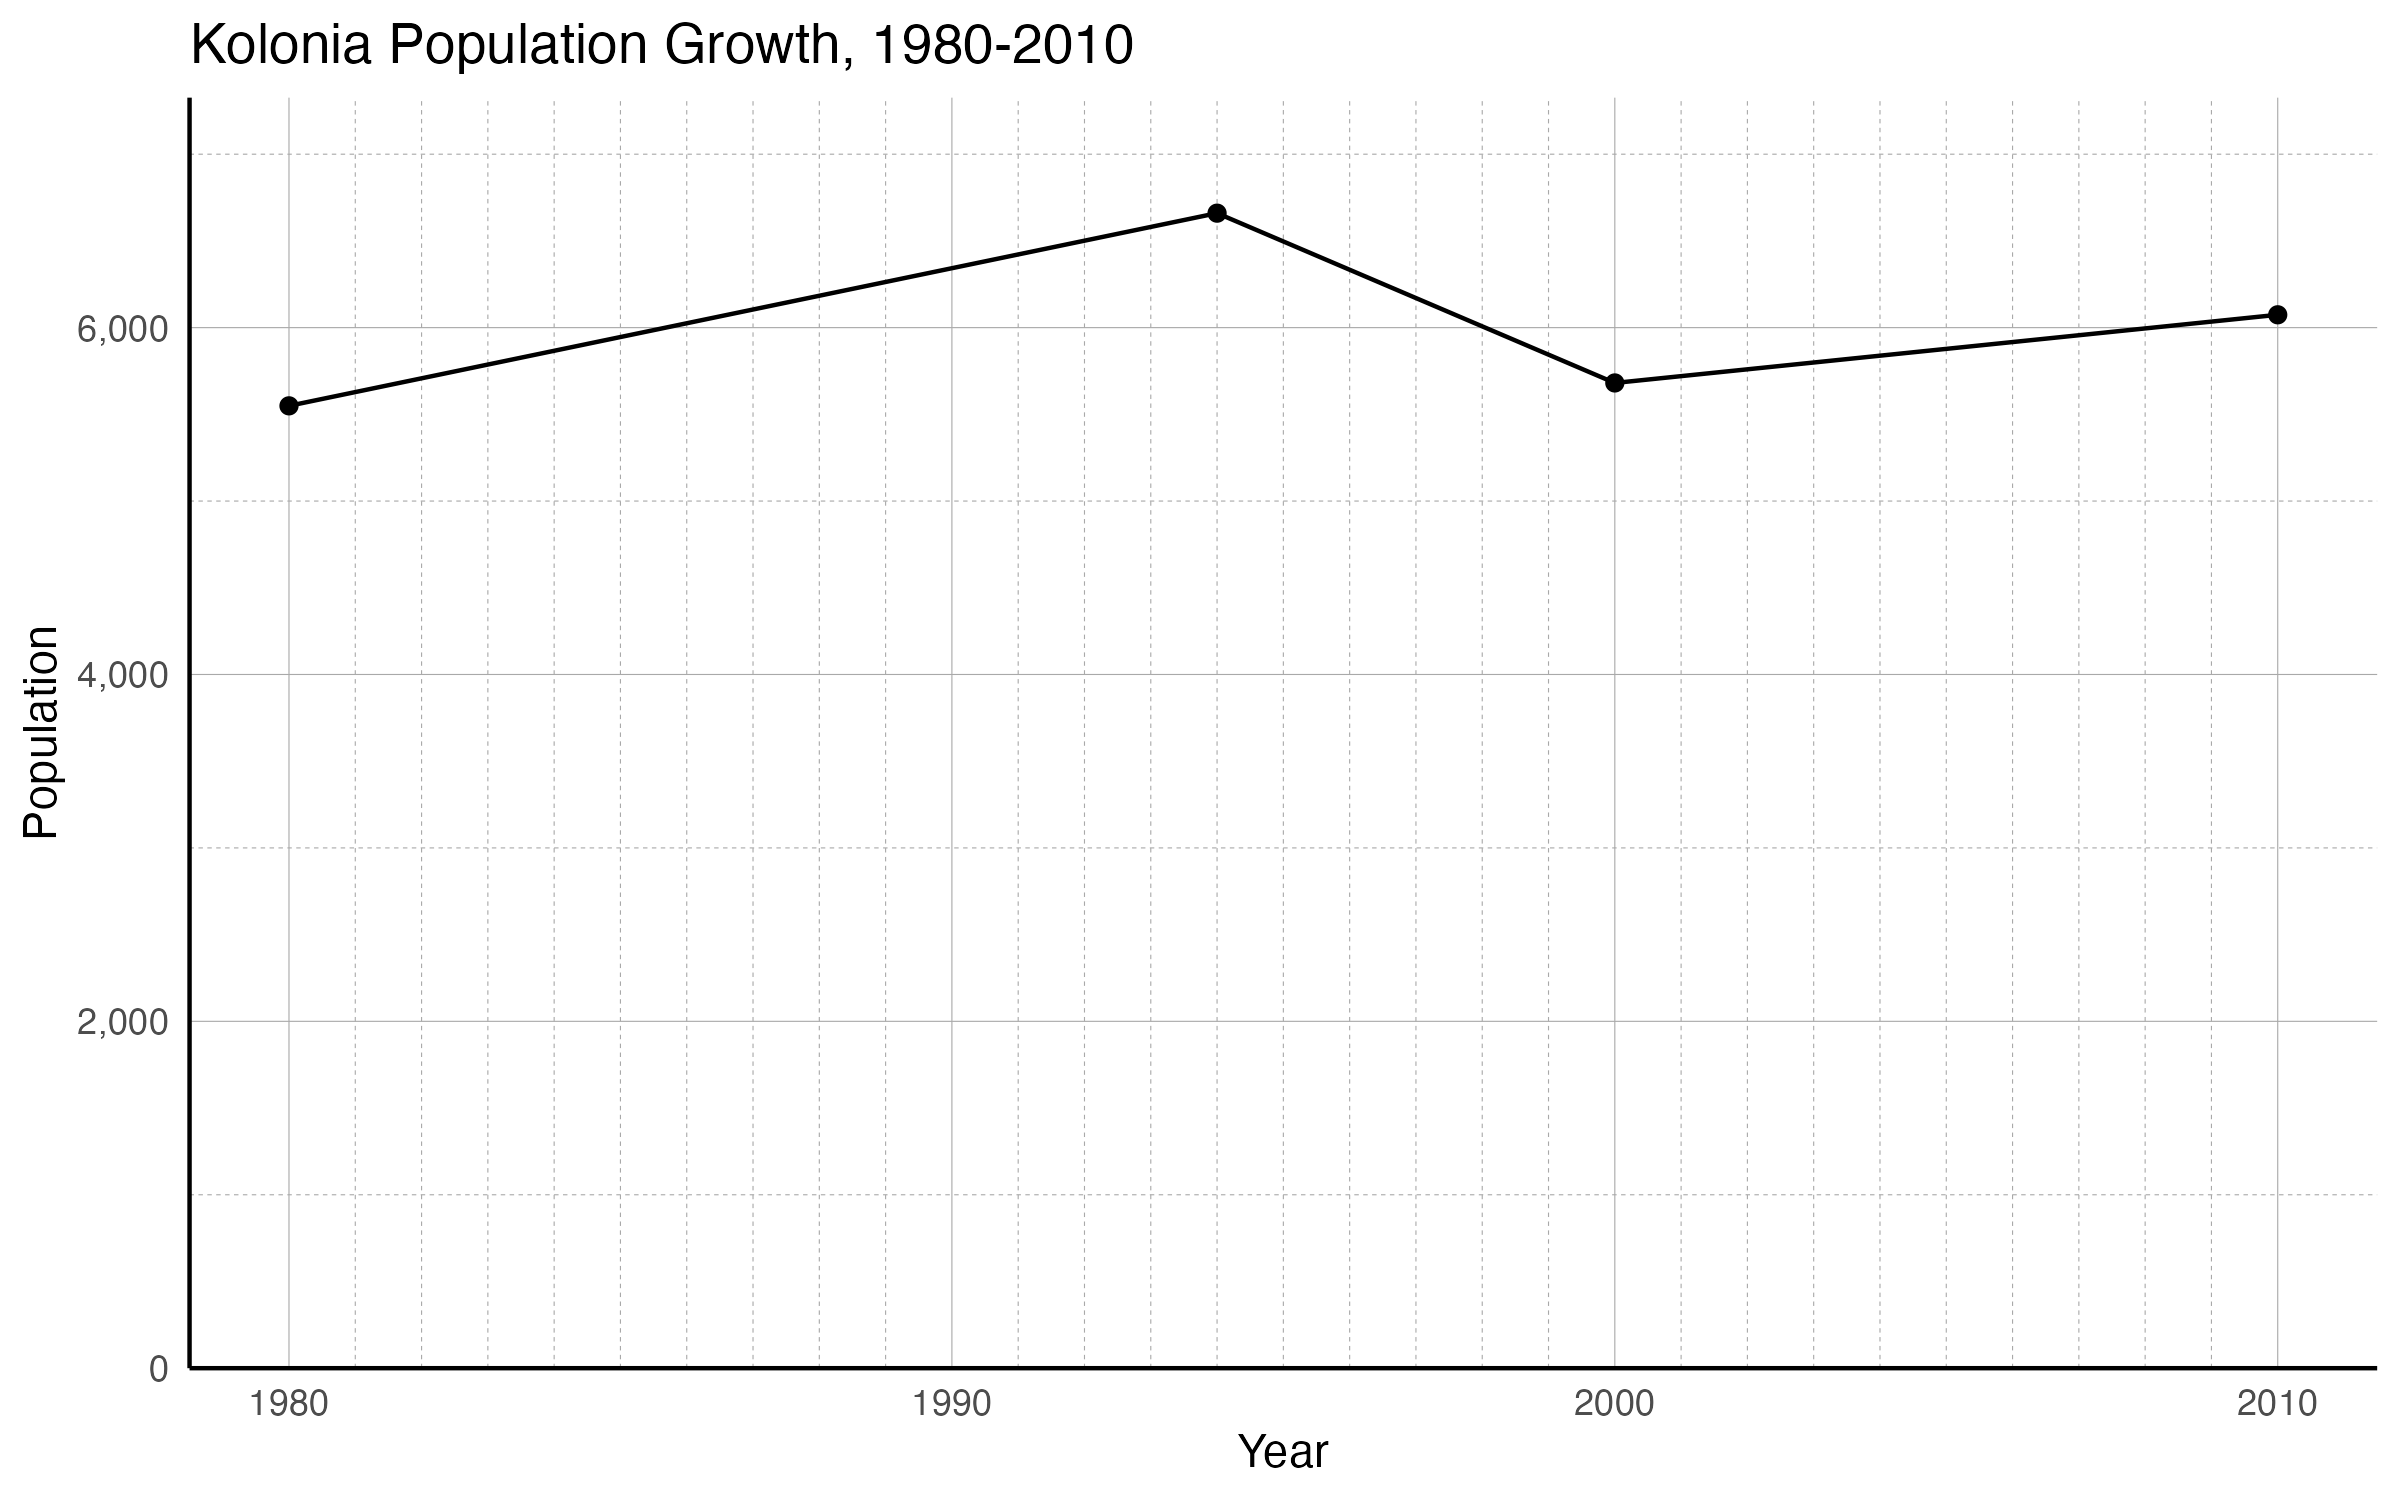
Population Growth
- Kolonia’s population increased by 10% from 5,549 in 1980 to 6,074 in 2010, at an average annual rate of 0.3%
- Population appears to have peaked in 1994
- It appears to be rising again since a minimum in 2000
Population figures are typically used as a denominator for many indicators, and are a measure of demand for services. The line chart above summarizes the city’s population change according to census and other public data. High growth of urban populations, caused by rates of natural increase (more births than deaths) in urban areas, migration from rural to urban areas, and the transformation of rural settlements into urban places, puts pressure on cities to meet the new demand.
Population Density
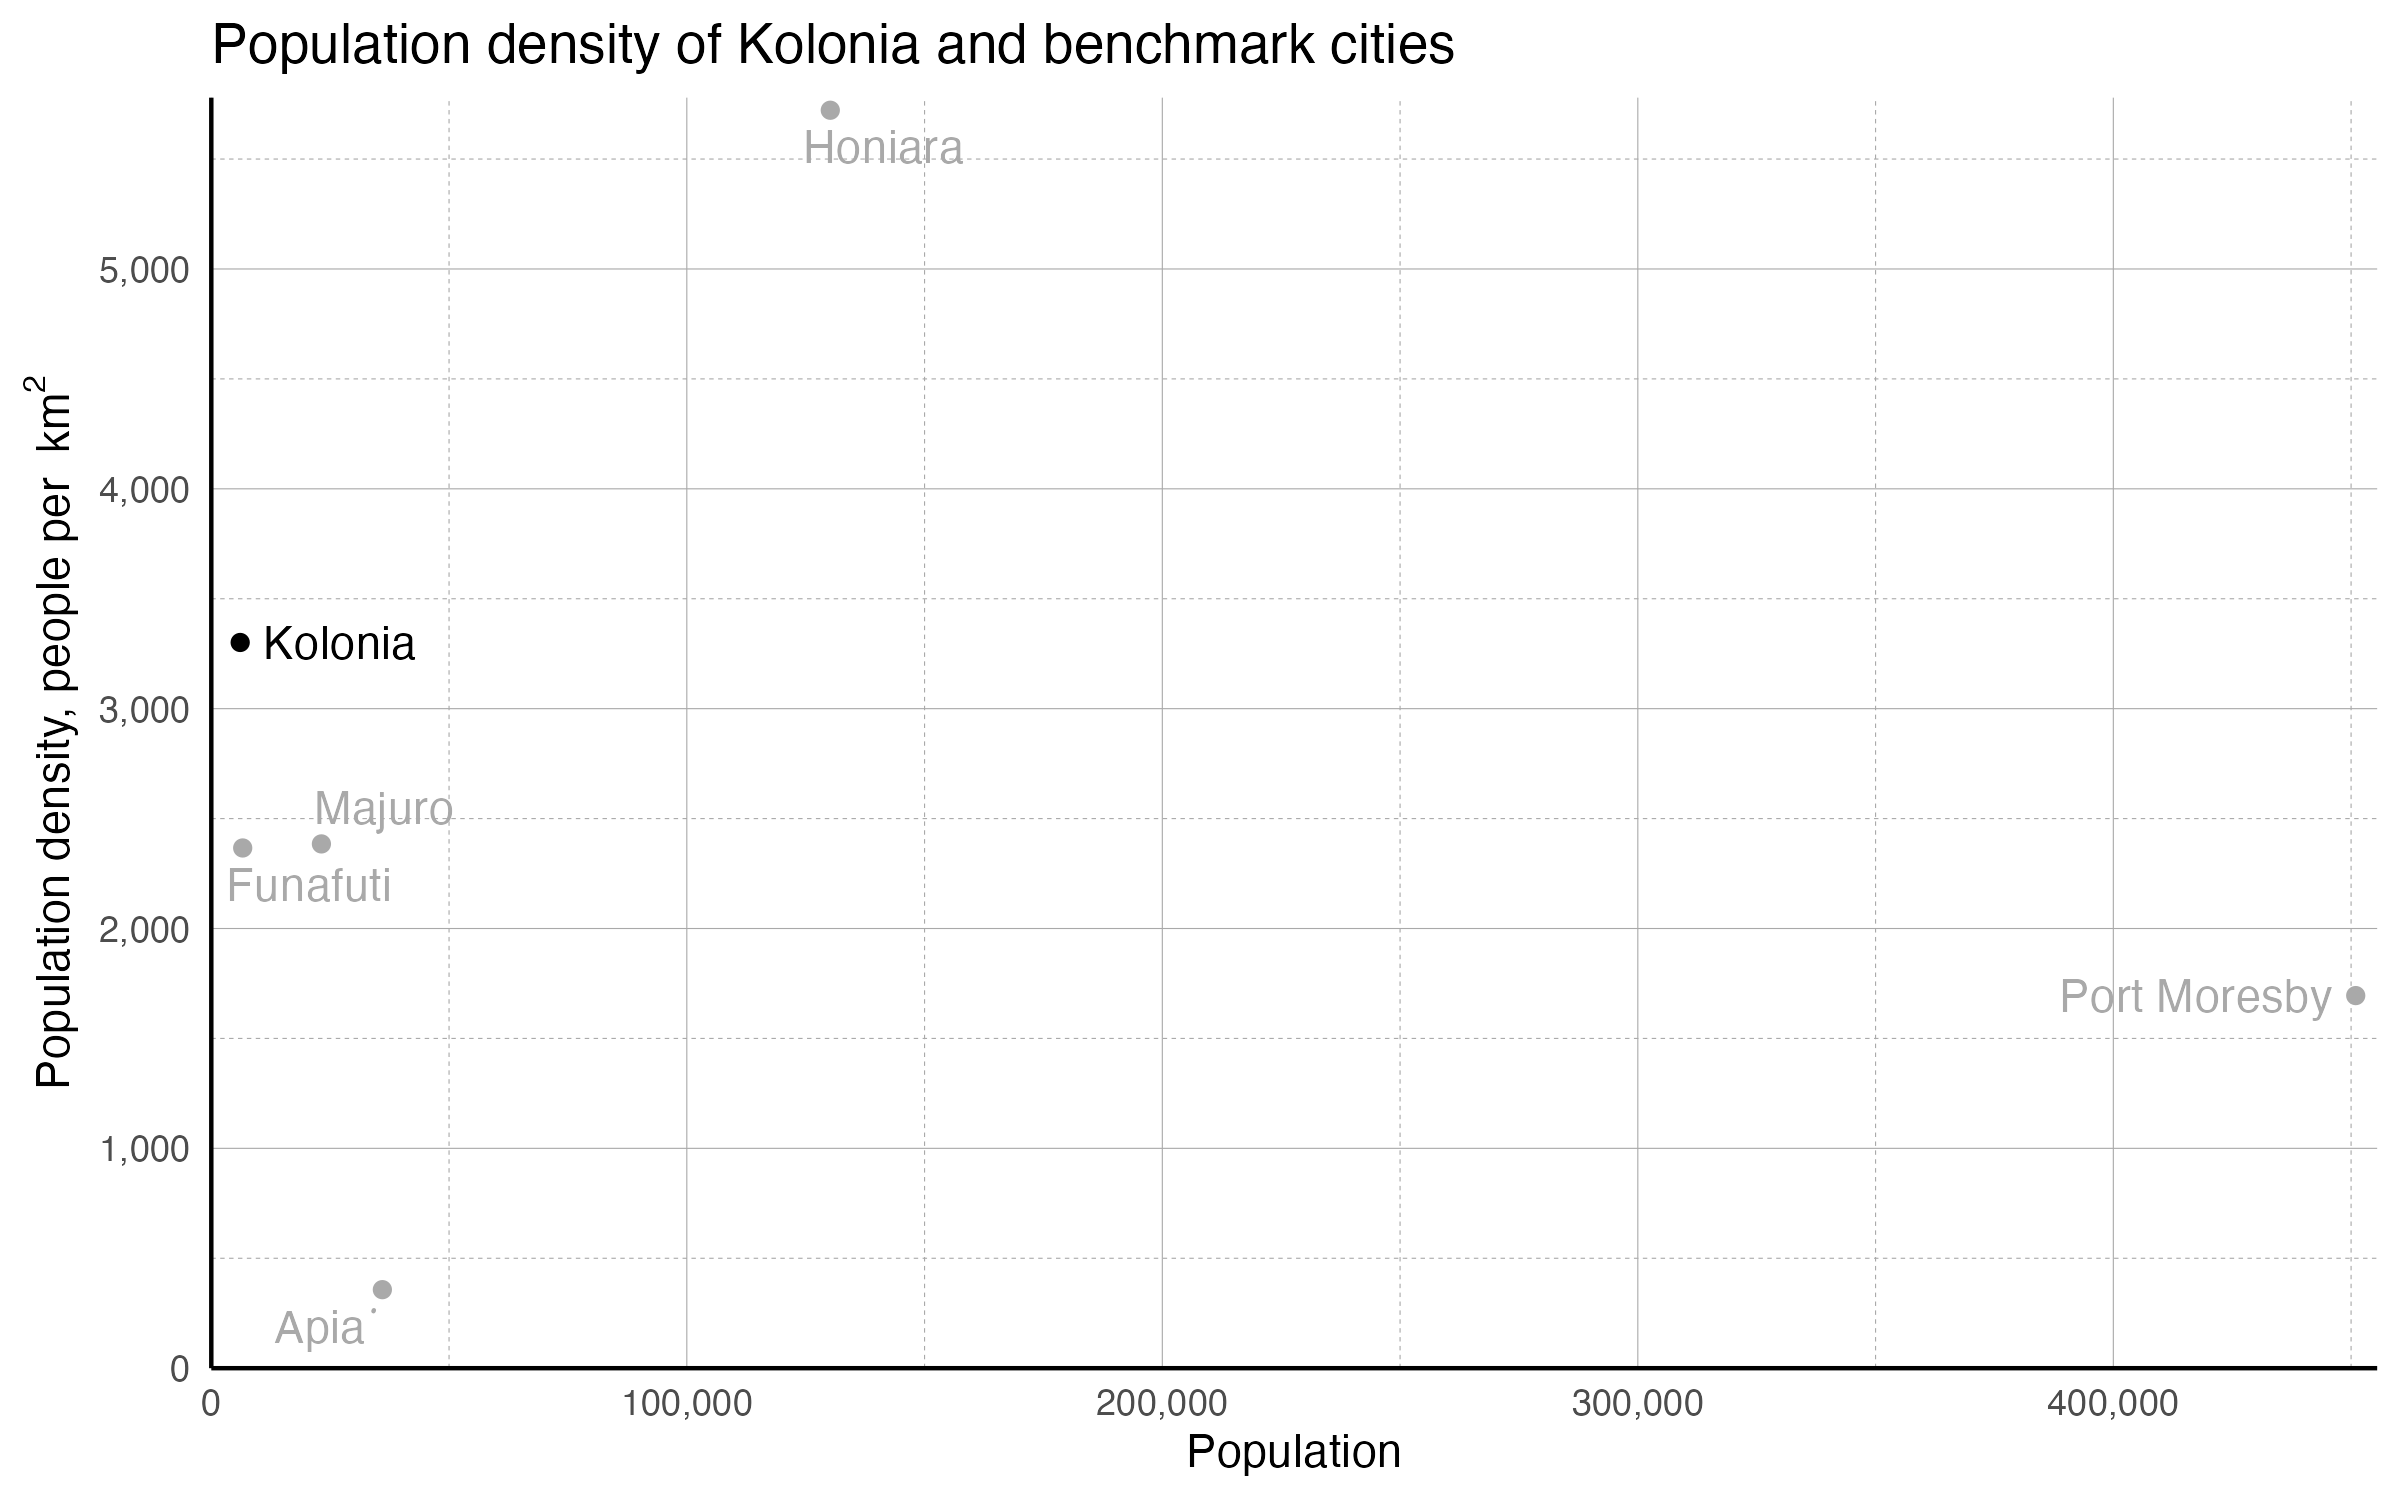
- 6,074 people live in 1.8 km2 of Kolonia, for a density of 3,301 people per km2
- Note that 1.8 km2 only includes the most populated portion of the AOI’s 7.6 km2
- Among the 5 regional benchmark cities, Kolonia has the 2nd highest density
Density is calculated using the most recent census population recorded and the official land area occupied by the city, and is an important measure of how cities function. Higher population density enables governments to more easily deliver essential infrastructure and services in urban areas at relatively low cost per capita. However, such benefits do not materialize automatically or inevitably. Whether a city’s population dynamics pose challenges or offer opportunities typically depends on the policies in play.
Populations and area are from Oxford, 2022, “Oxford Economics” or CityPopulation.de. Note that Oxford Economics uses quite large extents for its cities, meaning that the measured density is likely considerably lower than the density experienced by most inhabitants of the cities. Extents used by the both data sources may differ from the AOIs used by the City Scans.
Population Distribution by Age & Sex
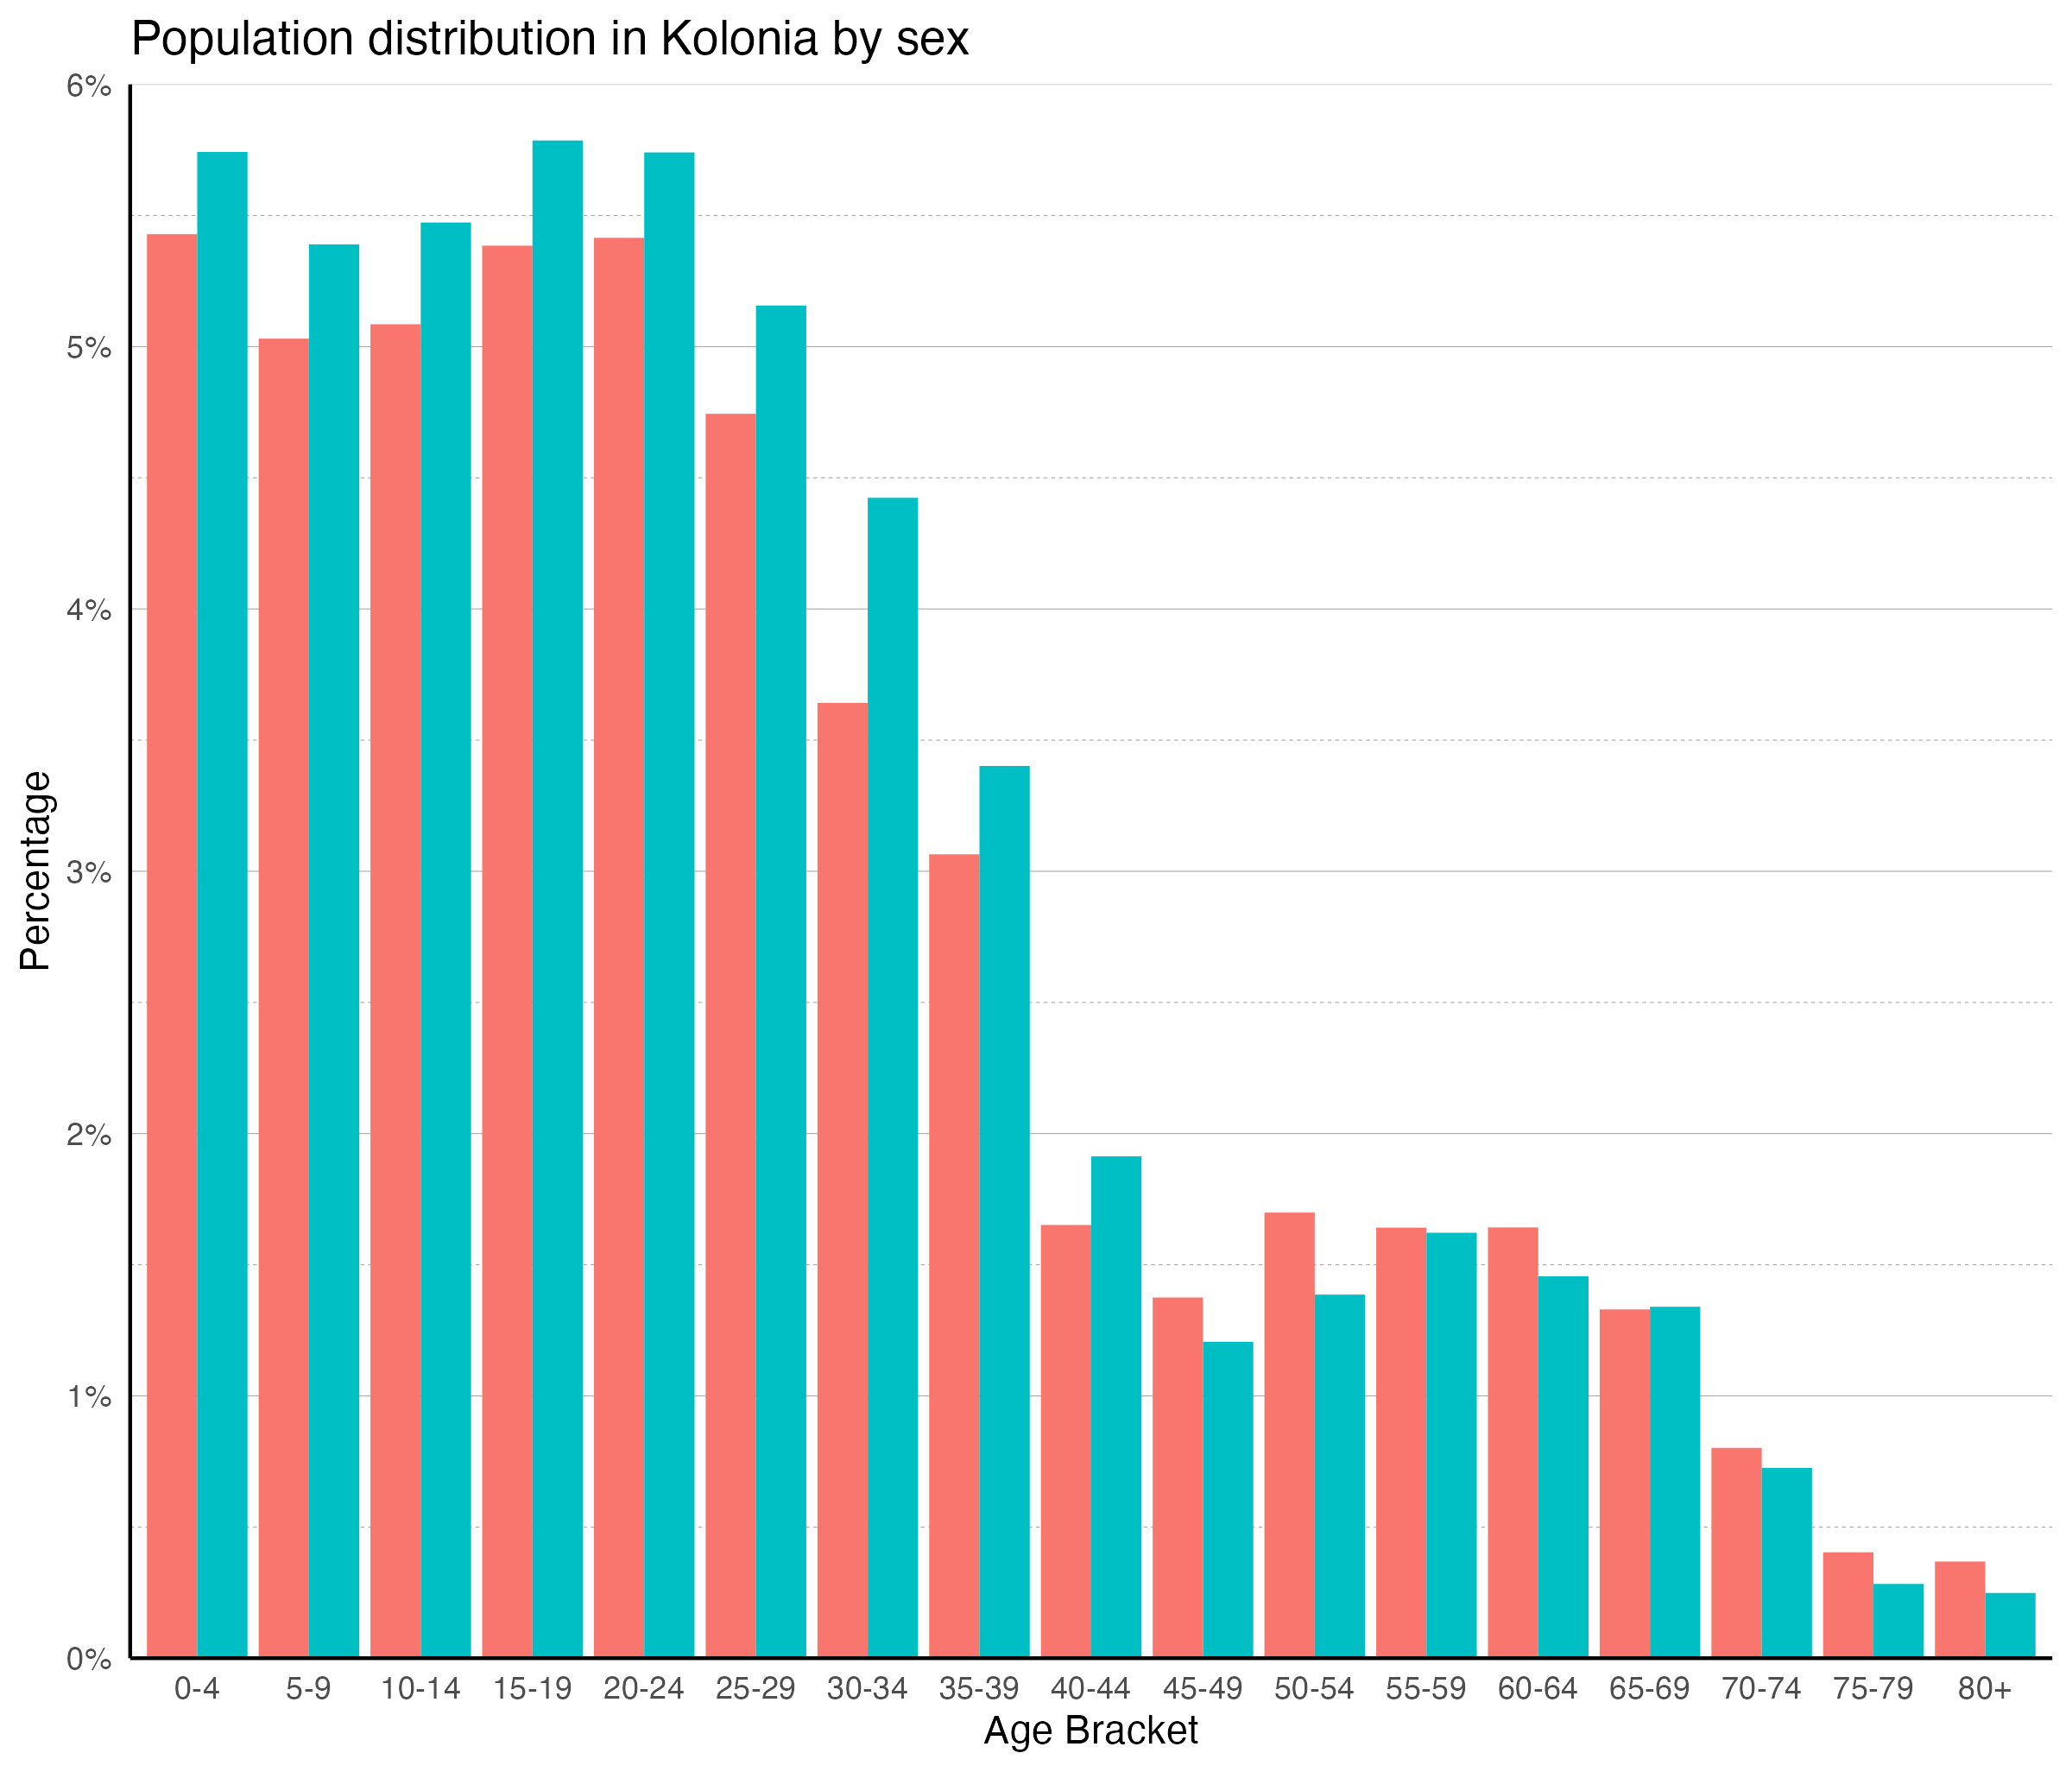
- Kolonia’s population is very young, with relatively few people over the age of 40
- The largest age groups for both females and males are ages 0–5 and 15–24
- 22% of the population is aged 15–24 and 11% are under 5
- 62% of the population is of working age (15–64)
- 9% are 60 or older
- There are more men than women (105 to 100) and the median male is younger than the median female
- 52% of all women in Kolonia are of reproductive age
This column chart classifies the city’s population according to age group, forming the basis of population projections. Populations vary significantly in their proportions of young and old people, with growing populations generally appearing younger, and declining or slowly growing populations generally appearing older.
Data from WorldPop. Bondarenko, et al, Estimates of total number of people per grid square broken down by gender and age groupings for 51 countries across sub-Saharan Africa in 2020 using Ecopia.AI and Maxar Technologies building footprints, 2020.
Reproductive age is defined as 15–49. Working age is defined as 15–64.
Economic Activity
Economic Hotspots
- Economic activity is highest in the town of Kolonia, in the mainland’s north, and along the western coast of Dekehtik
- It is lower along Nett Cir Island Road
This map measures the total emissions of nighttime lights from the monthly average of radiance for 2014 through 2022. Nighttime light radiance is a common proxy for economic activity: where there is more artificial light, there is generally more commercial activity. VIIRS observations are made fairly late at night, as its satellites cross the equator at around 1:30 local time; thus, the observed lights are typically street lights and nights which are left lit all night long. The correlation of nighttime light and economic activity is strongest for urban areas; it is less relevant in agricultural areas and areas with very low population density.
Map data from NOAA, “VIIRS Daily Mosaic”.
Change in Economic Hotspots
- Economic activity appears constant throughout much of the area, including along Circle Island Road
- Economic activity is decreasing the most in the areas where it is currently the highest, such as western Dekehtik and Kolonia
- Activity is increasing the most just to the west of these areas
- Note that map’s legend is centered at -0.6, so some red values indicate decreasing activity
The map illustrates monthly temporal changes from 2014 to 2022 in the emission of nighttime lights, indicating changes in economic activity. Positive values represent an increase in the intensity of nighttime light emission and, by proxy, economic activity, while negative values represent a decrease in the intensity of nighttime light emission, and economic activity.
Map data from NOAA, “VIIRS Daily Mosaic”.
Built Form
Land Cover
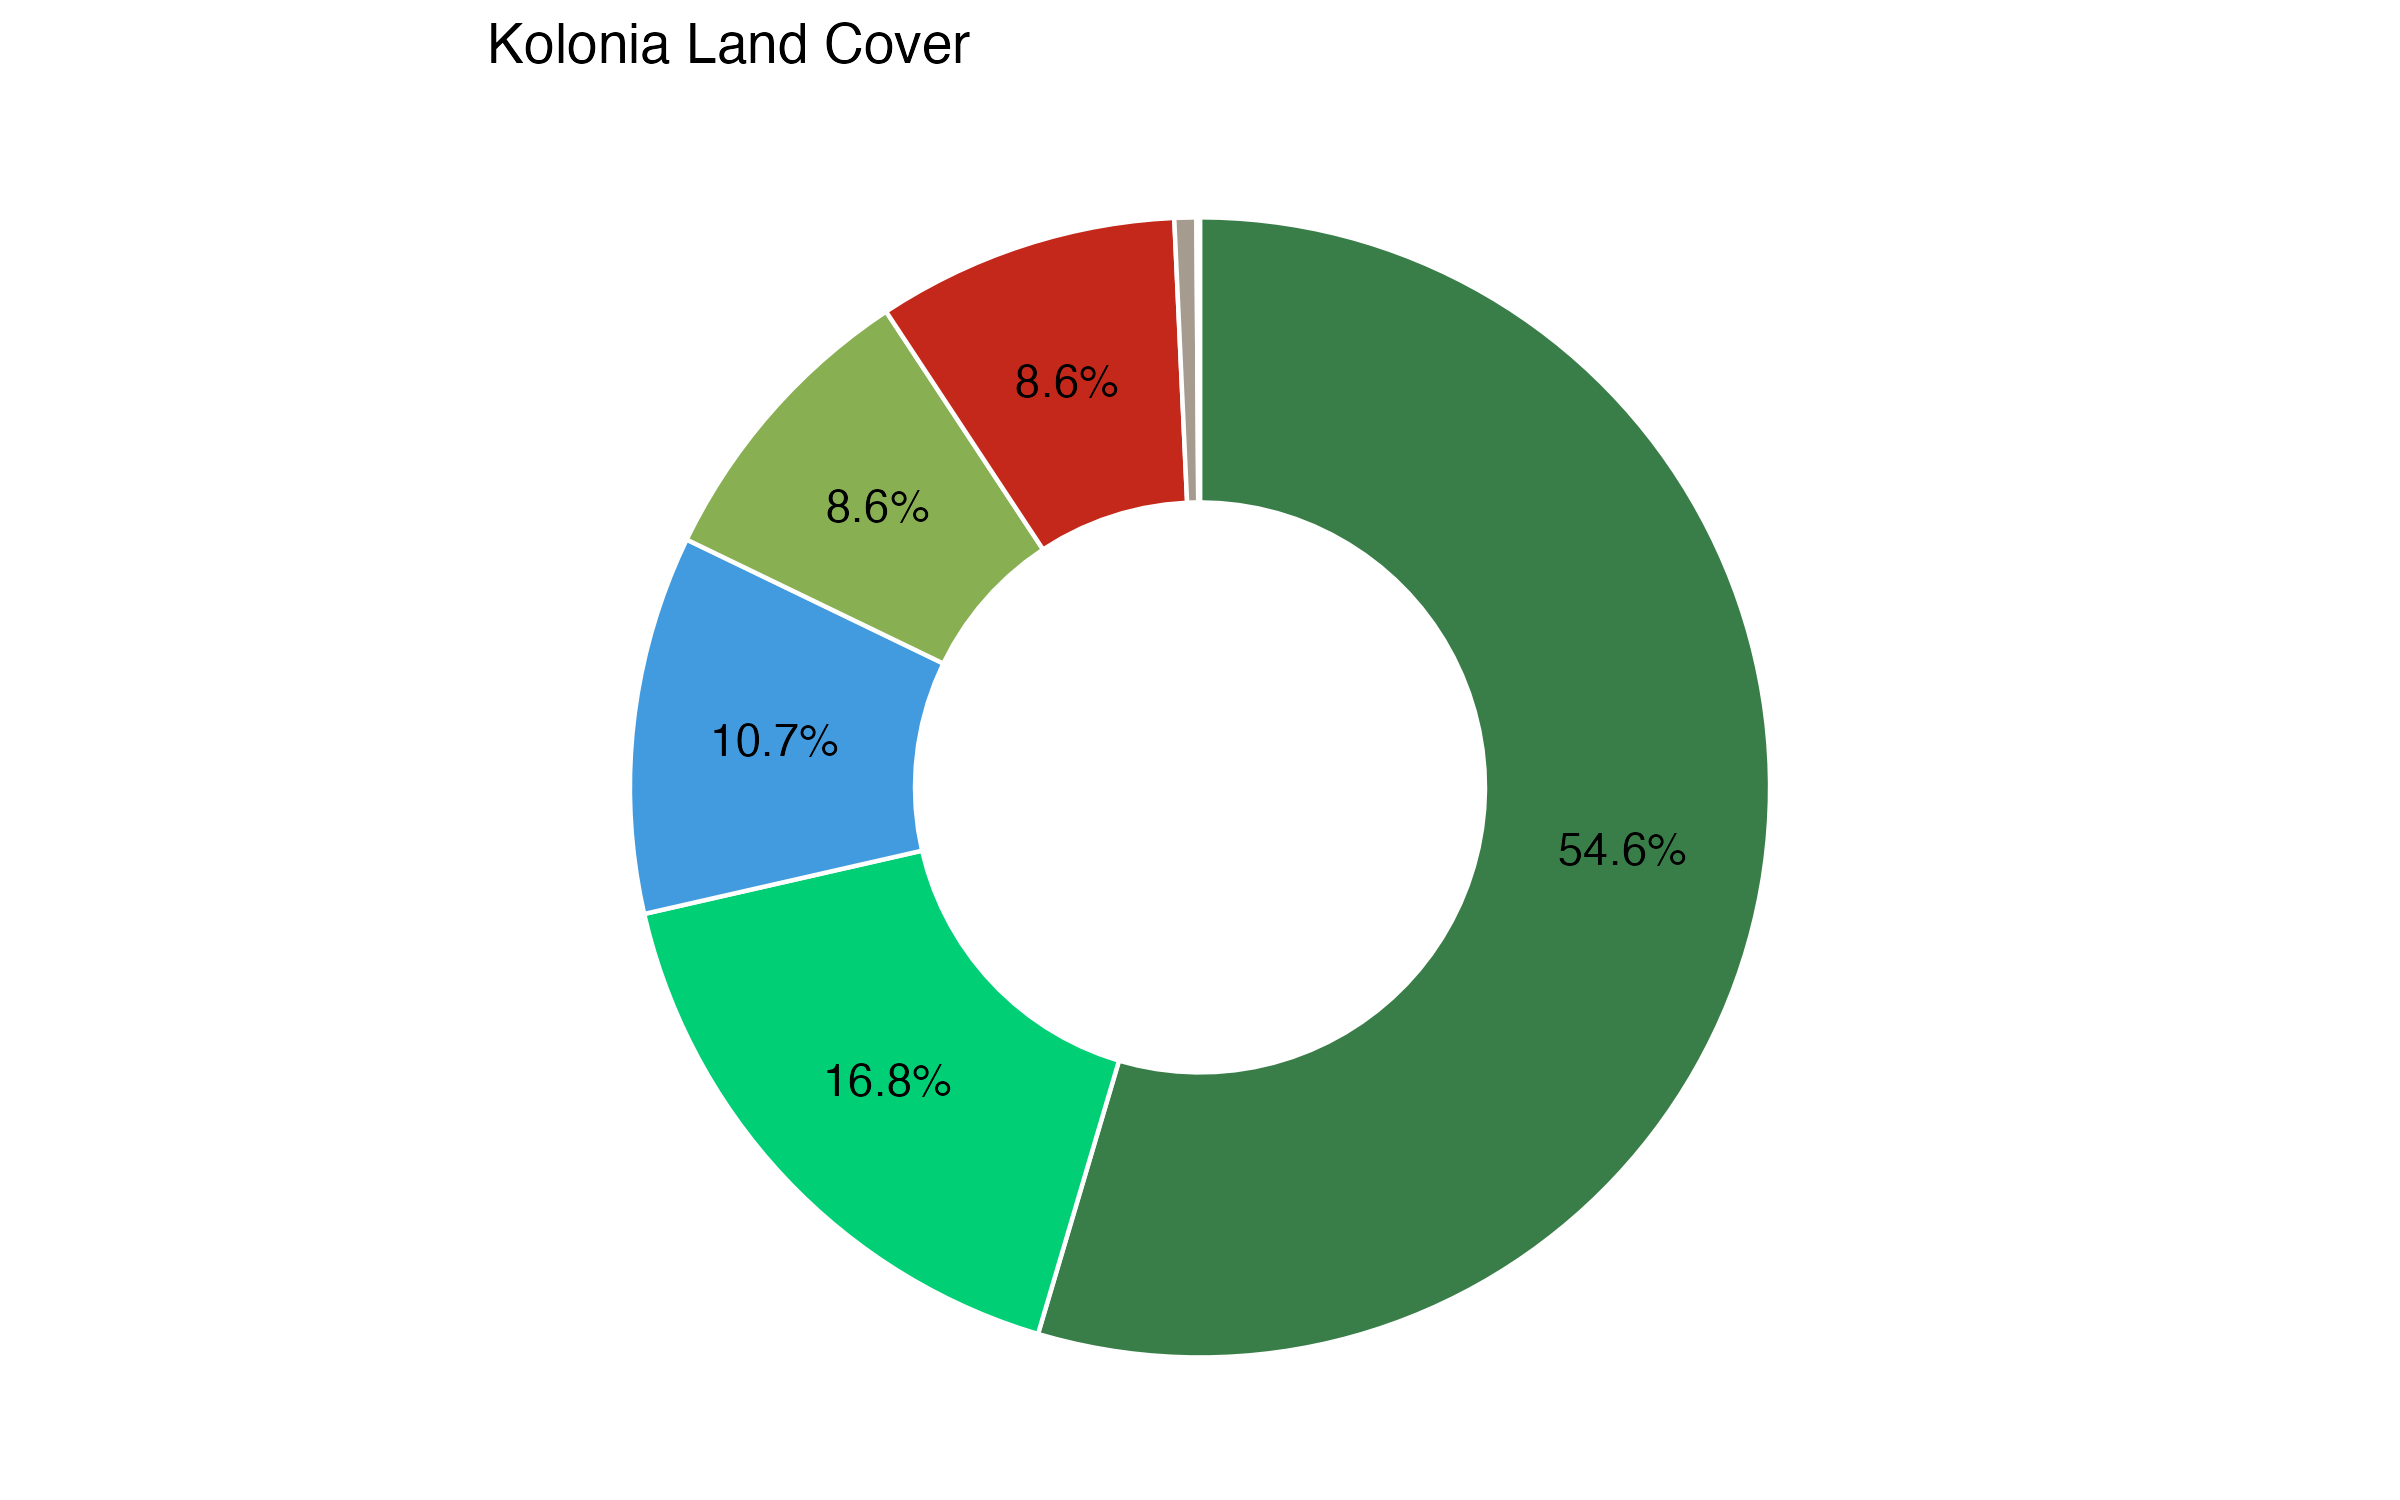
- 61% of the area’s land is under tree cover
- Mangroves comprise the next largest land class, covering 19% of non-water area
- The next largest non-water land classes are grassland and built-up area (each at 10% of land)
- Built-up area is primarily in the north
- The east–west portion of built-up area on Dekehtik Island is Pohnpei International Airport
Land cover refers to the ground surface cover, including vegetation, urban infrastructure, water, and bare soil, among other classifications. Identifying land cover type helps to understand land utilization and inform planning policies and programs.
© ESA WorldCover project 2020 / Contains modified Copernicus Sentinel data (2020) processed by ESA WorldCover consortium’
Access to Schools
- Schools are in the towns of Kolonia, in the north, and Palikir, in the south
- The densest areas are within a 1.6 km journey to a school
- The medium density areas along the highway are farther than 2.4 km from a school
Using a proximity analysis along the existing road network, this map identifies the areas that are most- and least-accessible to schools. The analysis includes all facilities classified in OpenStreetMap as a school, kindergarten, college or university. Note that there may be more schools that are not included in OpenStreetMap.
Map data from OpenStreetMap and DLR, 2015.
Access to Health Facilities
- There is one health facility, in the town of Kolonia
- The most popoulous are within 2 kilometers of the facility but many settled areas are not
Using a proximity analysis along the existing road network, this map identifies the areas that are most- and least-accessible to schools. The analysis includes all facilities classified in OpenStreetMap as a health amenity, clinic, or hospital. Note that there may be more health facilities that are not included in OpenStreetMap.
Map data from OpenStreetMap and DLR, 2015.
Climate Conditions
Solar Photovoltaic Potential
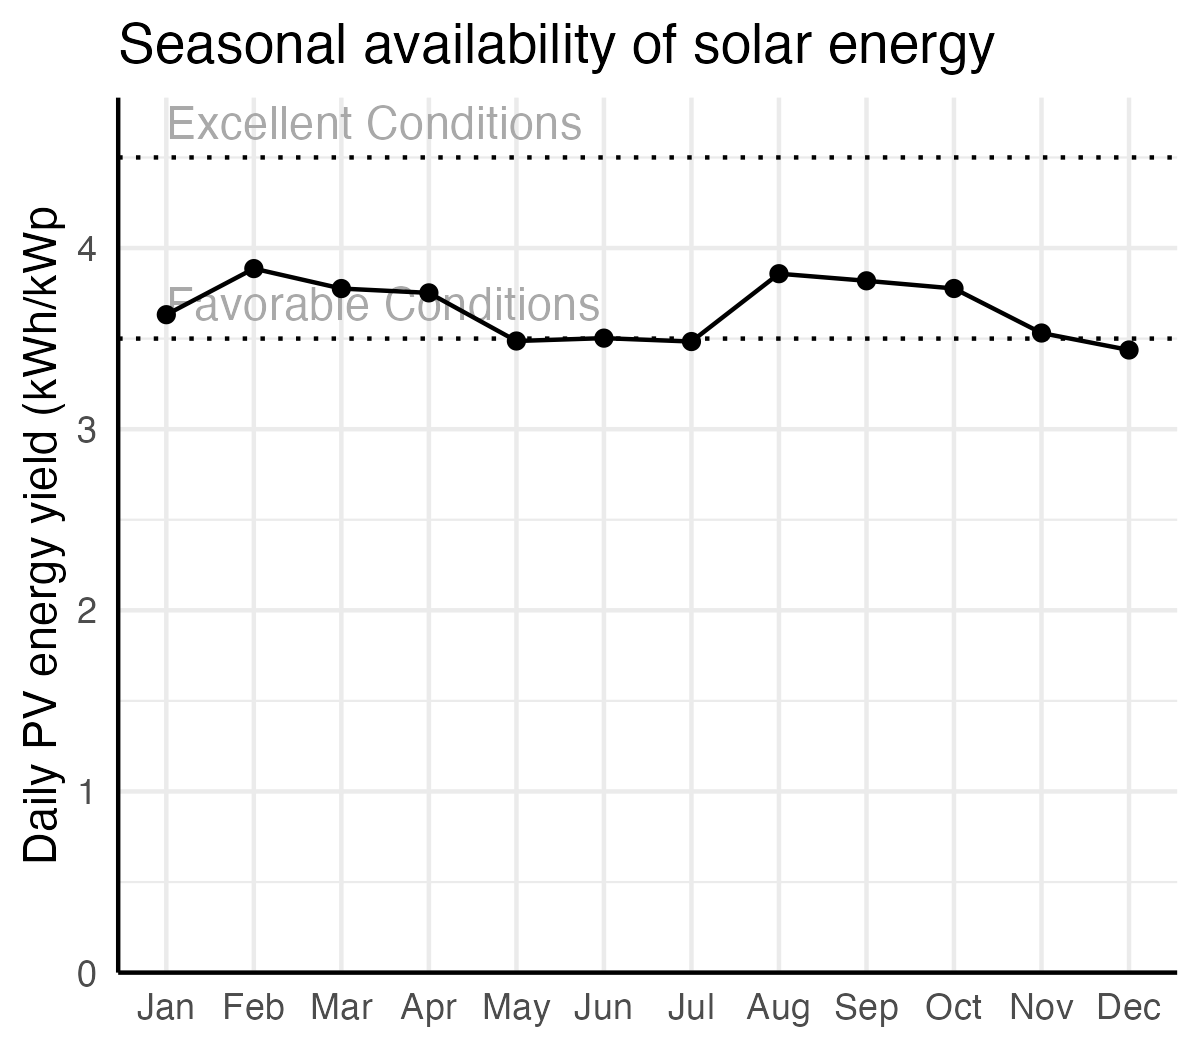
- PV power potential in Kolonia is favorable (1,380– 1,400 kWh/kWp annually)
- Seasonality is very low, with favorable conditions in almost every month, which makes solar electricity more feasible
- Solar power is most available on Dekehtik Island, north of the airport
Solar electricity offers a unique opportunity to achieve long-term energy sustainability goals. Photovoltaics (PV) is the most widely applied and versatile technology for solar power. The availability of solar energy depends on site conditions. This map displays an indicative estimate of daily specific yield, that is, how much energy a hypothetical PV system would produce for per unit of capacity (kWh/kWp). Values above 4.5 are considered excellent availability, while values between 3.5 and 4.5 are moderate.
Map data obtained from the “Global Solar Atlas 2.0, a free, web-based application is developed and operated by the company Solargis s.r.o. on behalf of the World Bank Group, utilizing Solargis data, with funding provided by the Energy Sector Management Assistance Program (ESMAP). For additional information: https://globalsolaratlas.info
The Global Solar Atlas uses generalized theoretical settings for a quick assessment of PV power potential for a selected site. An optimum tilt angle of PV modules and 100% availability (no shutdowns due to failure) are assumed.
Air Quality
- The concentration of PM2.5 in the town of Kolonia is less than 5 μg/m3
- Air quality in Kolonia is better than the WHO safety standards of 5 μg/m3 of PM2.5
- Data is unavailable for much of the area, including Dekehtik Island, most of Circle Island Road, and eastern Palikir; it is likely, though, that these areas have similar air quality as the areas with data
The concentration of particulate matter (PM) is a key indicator of air quality since it is the most common air pollutant affecting short and long-term health. This map displays the average annual concentration (µg per m3) of ground-level fine particulate matter of 2.5 micrometers or smaller (PM2.5).
PM2.5 particles are of greater concern than PM10 particles because their small size allows them to travel deeper into the cardiopulmonary system. According to the WHO and the United States EPA standards, PM2.5 concentrations should not exceed between 5 µg/m3 or 12 µg/m3, respectively. Higher concentrations of particulate matter may also reduce the availability of solar energy.
PM2.5 Grids are derived using annual data from 1998-2019 represent near-surface concentrations.
Map data from Hammer, 2022, “Global Annual PM2.5 Grids”.
Vegetated Areas
- Vegetation is densest to the south of Palikir, and on Dekehtik Island south of the airport
- Vegetation is also dense along parts of Circle Road
- Vegetation is more sparse within Kolonia, but nonetheless relatively dense for a developed area
- Only the airport and small parts of the town of Kolonia show signs of no vegetation
- Areas with negative values are mostly coastal water that is included in the area of analysis
This map displays the Normalized Difference Vegetation Index, which ranges between -1 and 1, with higher numbers indicating a higher density of green vegetation. Values of less than 0.1 typically indicate water, rock, and otherwise barren land; values of 0.1 to 0.3 are associated with shrubs and grassland; 0.3 to 0.5 corresponds to moderate vegetation; and values of more than 0.5 correspond to dense vegetation such as forests or mature crops.
Vegetation and green spaces in cities are associated with health benefits and the mitigation of environmental risks. More green space in a city can reduce temperatures and the urban heat island effect, lessen air pollution, and absorb floodwaters. Green spaces can also serve important civic, social, and quality of life functions.
Map data from European Space Agency, 2020, “Normalized Difference Vegetation Index”.
NDVI-based measures do not account for the proximity and spatial arrangement of green spaces within areal units. They also do not address the vertical dimension and density of green urban buildup.
Risk Identification
Elevation
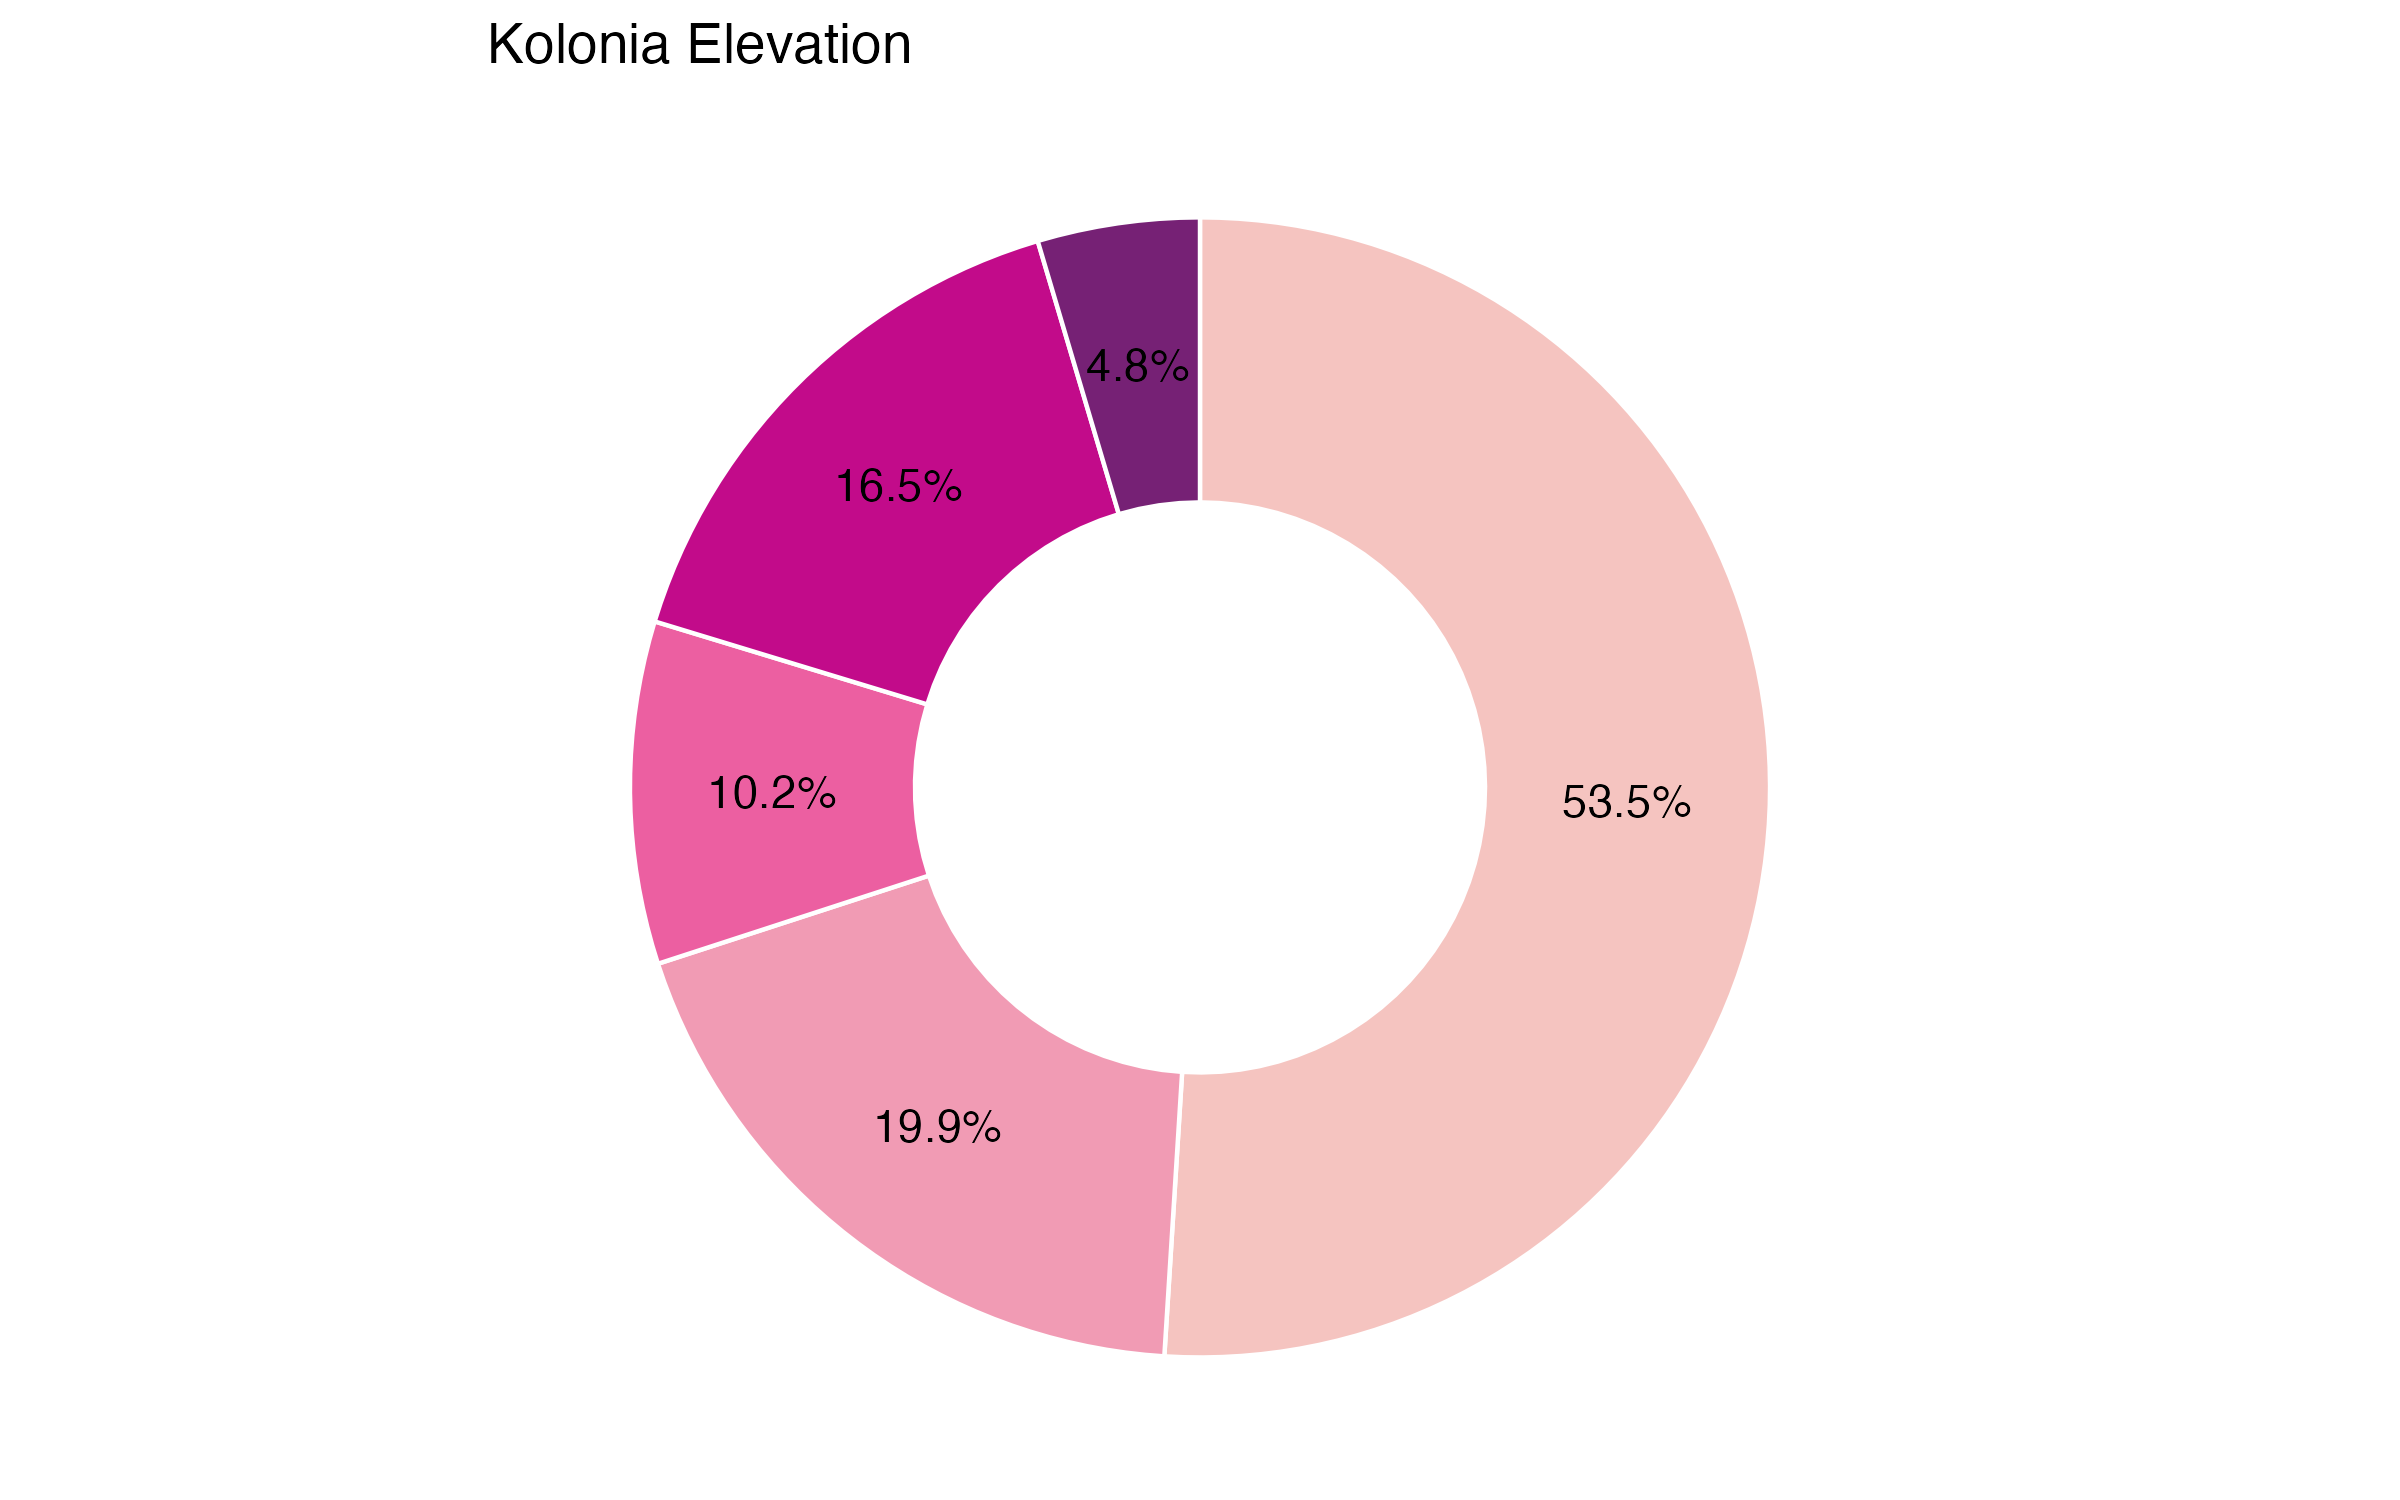
- Most of Kolonia is within 25 km of sea level
- The inland areas rise higher, up to 130 km above sea level
- There are two hills along the southern edge of the populated core
Elevation informs an area’s vulnerability to many natural disasters. The height at which infrastructure, resources, and communities sit relative to normal water levels and tides, flood waters, and storm surges and waves informs their exposure. Elevation information is critical for communities to anticipate the impacts of disasters and to prepare resilient and cost-effective response and redevelopment strategies.
Map data from FABDEM V1-2.
Slope
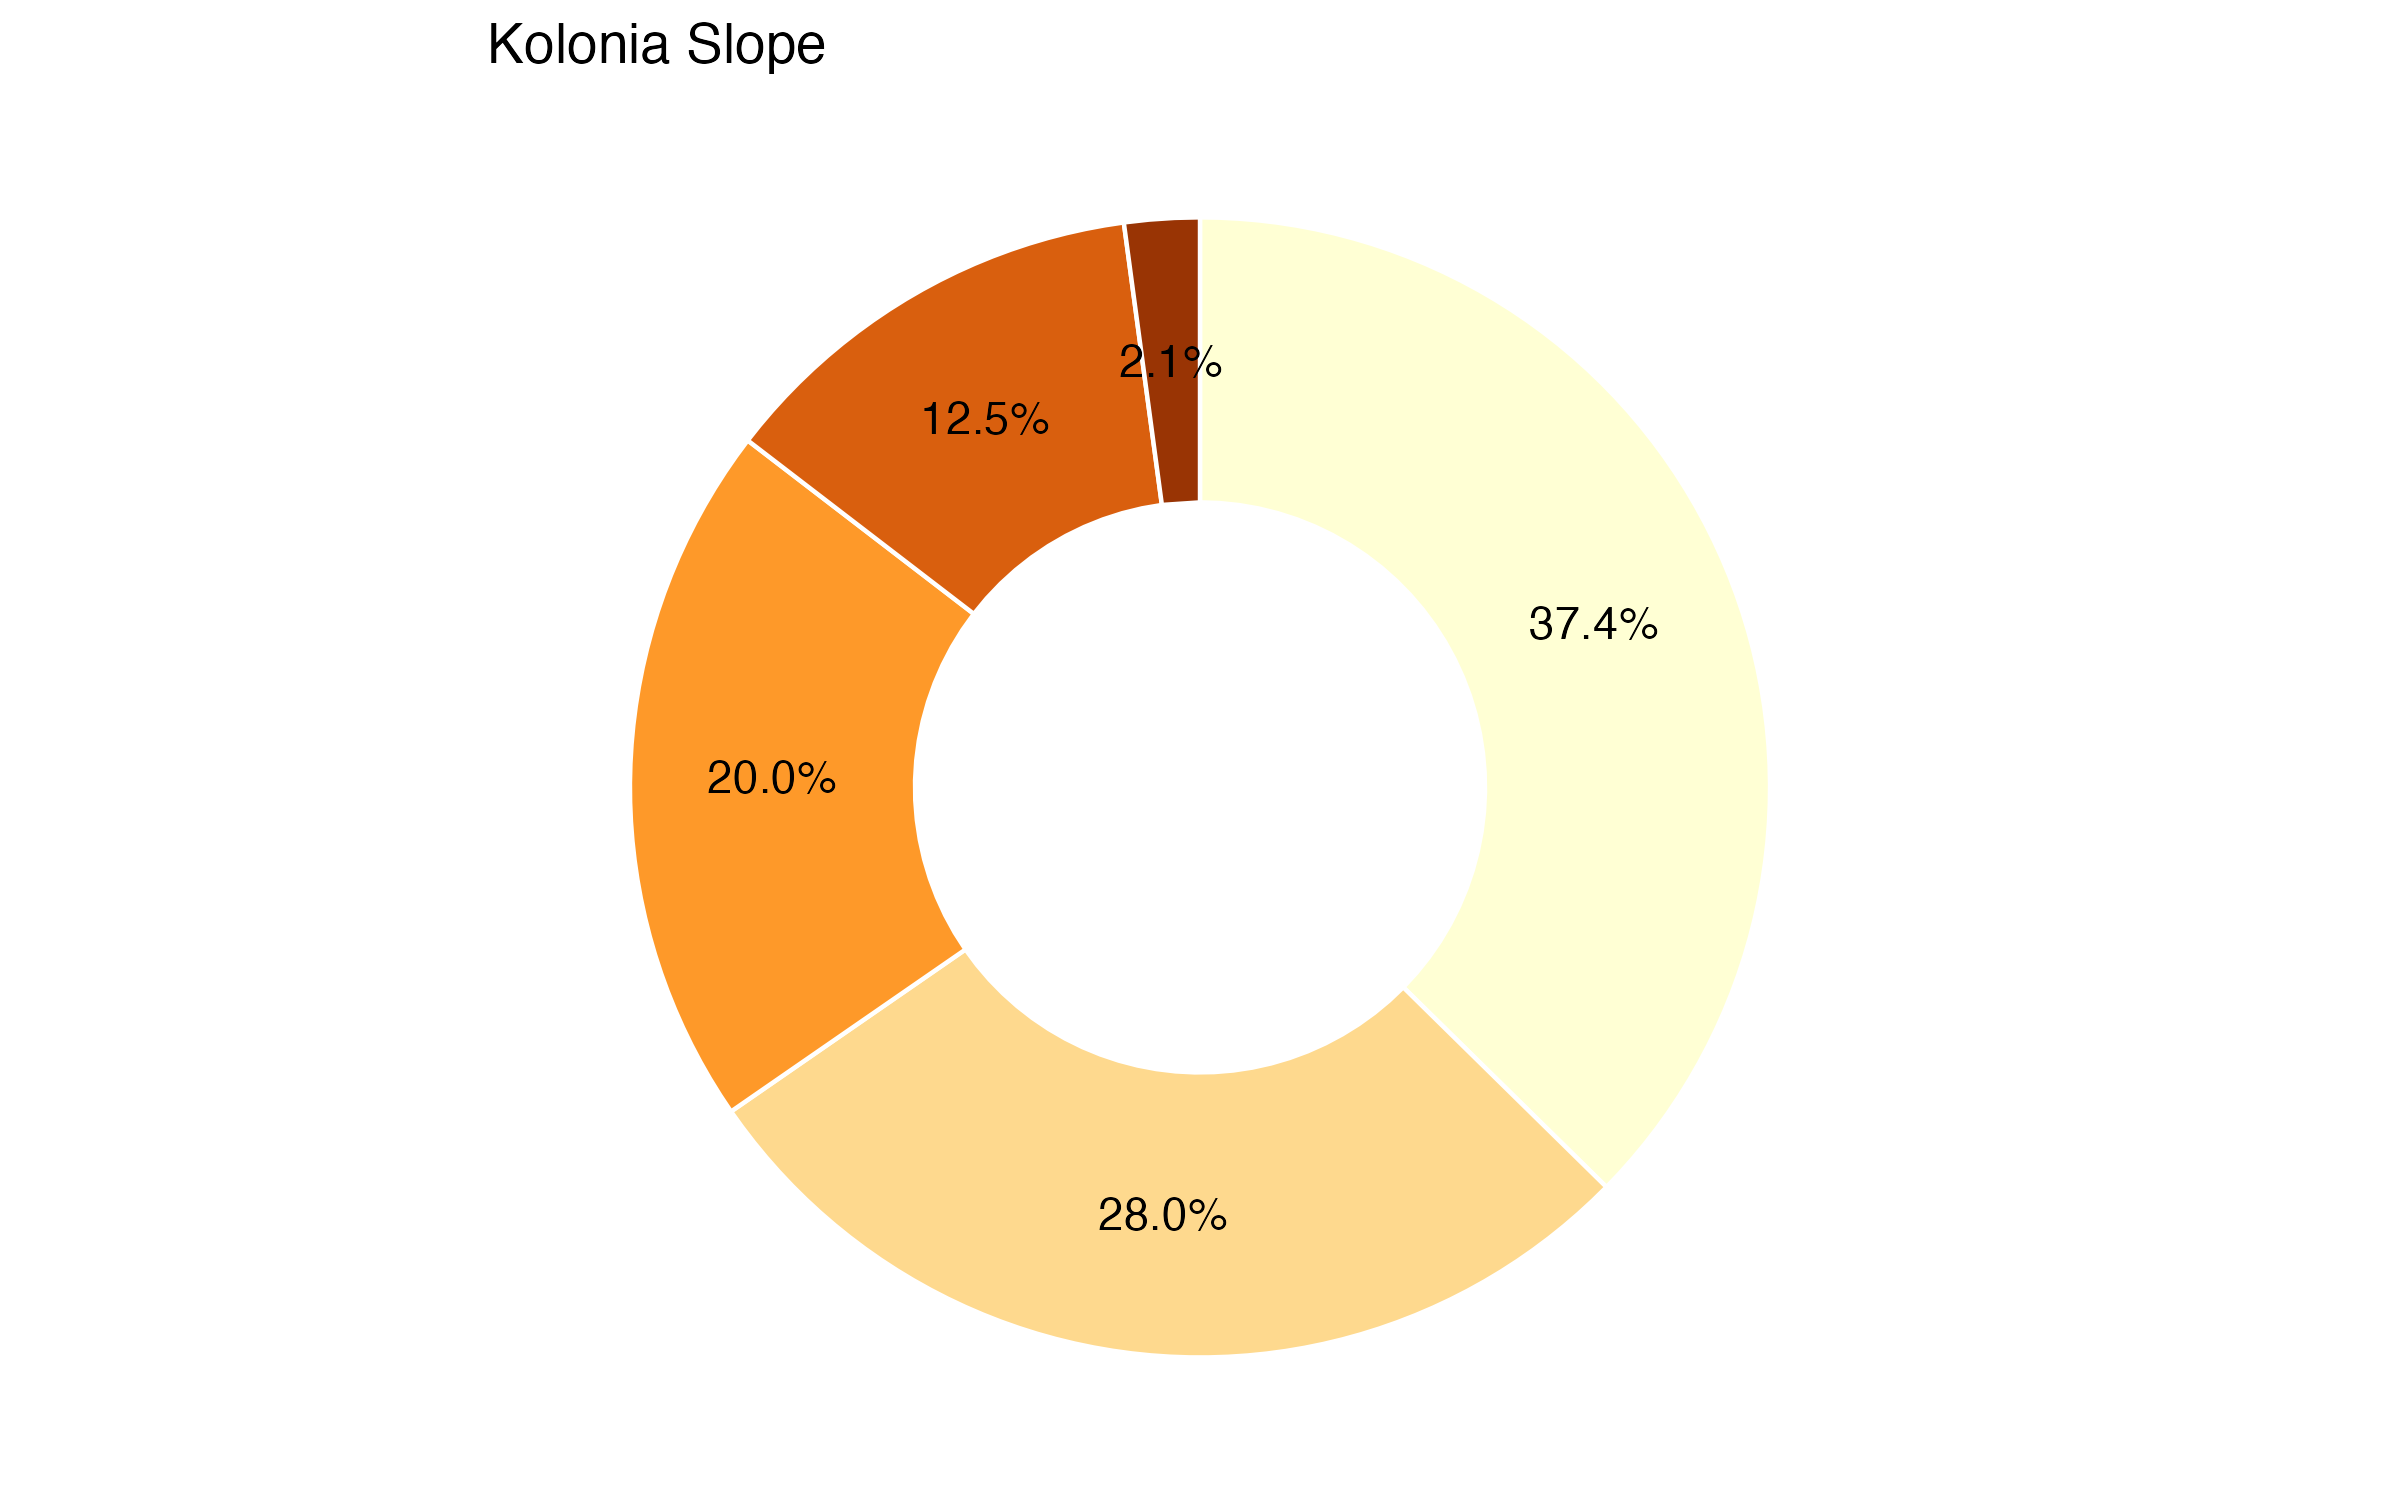
- The terrain in Kolonia is quite steep
- 62% of the area is steeper than 2° (3.5% grade)
- These steeps slopes spread across the entire extent, but are especially great in the medium density areas along the highway connecting the towns of Kolonia and Palikir
Slope refers to the percentage change in elevation over a certain distance. In hilly or mountainous areas, floods can occur within minutes after heavy rains, while in flat areas, floodwaters can remain for days. Considering the slope of land is important in reducing construction costs, extending services and public facilities, minimizing the risks of hazards like flooding and landslides, and mitigating the impacts of development on natural resources.
Map data from USGS, 2015, “USGS EROS Archive - Digital Elevation”.
Landslides
- Landslide susceptibility ranges between very low and low Kolonia
- It is low on the main island, and very low on Dekehtik
This indicator refers to the likelihood that a landslide will occur in a particular area based on local terrain conditions. It shows the degree to which a terrain can be affected by slope movements, i.e., an estimate of “where” landslides are likely to occur. Susceptibility does not, however, consider the temporal probability of failure (i.e., when or how frequently landslides occur), nor the magnitude of the expected landslide (i.e., how large or destructive the failure will be).
This map combines satellite observations of rainfall with an assessment of the underlying susceptibility of the terrain. Steep slopes are the most important factor in a landscape’s susceptibility to landslides. Others include deforestation, presence of roads, strength of the bedrock and soils, and location of fault lines.
Map data from NASA, “Landslide Susceptibility Map”.
Liquefaction
- Liquefaction susceptibility is very high in Kolonia and high in Palikir
While all of the city has the same likelihood of seismic activity, areas within a city will typically have differing levels of vulnerability, due to factors such as soil and building construction. Liquefaction is a phenomenon where loosely packed or waterlogged sediments, particularly beneath buildings and under structures, lose their strength in response to strong ground shaking. Liquefaction in the event of an earthquake can cause increased damages.
This map calculates the likelihood of liquefaction using a combination of indicators such as peak ground velocity, precipitation and others. Each level determines a threshold of confidence regarding the probability of liquefaction in the particular pixel area.
Map data from Zorn & Koks, 2019.
roads
- The most critical segments in the area are those connecting the town of Kolonia to the roads to Palikir and Dekehtik
- The Nett Cir Island Road, connecting the towns of Kolonia and Palikir, also has high criticality
This layer visualizes an approximation of road network criticality. It highlights segments within a road network that, if blocked due to flooding or other hazards, would cause a high degree of disruption to travel across the city. Segments in red are the most critical for the overall connectivity of the city.
Note that cities vary substantially in their probability of disruption due to failure of a small number of road segments; for example, when a street network follows a grid pattern or has many alternative routes between destinations, the risk of disruption owing to the failure of key road segments is lower. In contrast, other cities have particular road segments whose failure would affect a large proportion of journeys across the city.
Map data from OpenStreetMap.
Criticality is measured by calculating betweenness for each segment. Betweenness for a segment is calculated by mapping the shortest path from each intersection to every other intersection, and then taking the percentage of all trips that use that segment.
Local Institutions & Planning
Administrative Structure
- The FSM is divided into four states: Chuuk, Kosrae, Pohnpei and Yap.
- The state government’s wield considerable authority, particularly regarding the implementation of budgetary policies;
- Kolonia is governed by Kolonia Town Government, which is responsible for the overall administration and development of the city;
- The Mayor is the executive head of the Kolonia Town Government;
- A statute is in place that grants Kolonia Town Government the authority to establish its own development plans;
- Pohnpei State has implemented a local government aid fund to provide support for local government operations, facilities, and projects
Availability Of Development Plans And Policies
- FSM’s medium-term development strategy is guided by its Strategic Development Plan (2004-2023);
- The FSM Infrastructure Development Plan FY 2016-FY2025 sets out the country’s priority infrastructure development projects over the plan period to 2025;
- The FSM has established a legal and institutional framework for urban planning, which includes national, state and local level plans;
- At the local level, municipal governments are responsible for preparing Zoning Plans for their respective jurisdictions;
- Despite these efforts, spatial planning is not well developed in the FSM. Challenges to implementation include weak institutional capacity insufficient funding, limited crosssectoral coordination and a lack of participatory planning processes
The State of Urban Infrastructure and Service Delivery
Land Administration
Land administration in Kolonia follows a system that combines traditional land tenure practices with contemporary legal frameworks This means that land ownership and management in the Federated States of Micronesia are influenced by cultural customs, customary land rights, and statutory regulations. The Pohnpei State Department of Land assumes a crucial role in overseeing land-related affairs within Pohnpei State, which encompasses Kolonia. The department is responsible for various functions related to land administration, land use planning, and land-related policy development, and employs a modern land management system, which includes land surveying, recording of land titles, land registration, protection of registered titles, documentation of land transactions, and the utilization of public lands. Since 2018, the Asian Development Bank has been supporting the government of Pohnpei in implementing land management reform aimed at enhancing the productive use of private lands for economic growth.
Housing
The FSM, comprising numerous islands, confronts several significant housing challenges. Being a small island developing state, the territory faces multiple barriers to growth due to its geographic location, small population, capacity constraints, and susceptibility to natural hazards. Moreover, the country’s population growth and rural-urban migration have intensified the need for housing solutions, making it a critical policy concern. A major hurdle in providing affordable housing is the complex landscape of land ownership and administration, limiting available land for housing development. Consequently, large squatter settlements have emerged in urban and peri-urban areas with inadequate facilities and a lack of legal tenure rights for occupants. The continued expansion of informal settlements, coupled with urban growth, heightens vulnerability when houses are built on land highly exposed to potential disasters.
Energy
The energy sector in the FSM faces numerous challenges, including low energy security, high electricity cost, limited electrification rate in certain states and climate change impacts. One notable challenge is the heavy reliance on fossil fuels for electricity generation and transportation, which renders the nation highly susceptible to petroleum price volatility and shocks. In 2012, the government approved the National Energy Policy (NEP) with the aim of increasing access to safe and affordable electricity and reducing dependence on imported energy sources. Subsequently, the NEP targets were revised in a 20-year masterplan, aiming to achieve an electrification rate of nearly 100% and 84% of electricity generated from renewable sources by 2037. As of 2018, approximately 76% of households in the FSM had some form of electrification, with Pohnpei achieving an impressive rate of 95%.
Disaster Risk Management
Given the FSM’s exposure to hazards and anticipated rise in vulnerability due to climate change, the country has implemented a comprehensive program for disaster risk reduction (DRR) and climate change adaptation (CCA). This establishes clear responsibilities for both the government and communities involved. In addition to policy development, the National Disaster Committee (NDC) undertakes coordination in the event of a disaster. Decision-making authority for preparedness and response primarily rests with each State Governor, while State Disaster Committees oversee disaster planning and overall response management. At the local level, there are Disaster Management Committees and customary leaders responsible for disaster preparedness. In times of emergencies, National and State Emergency Operations Centers (NEOC and SEOC) are engaged to oversee operations and response efforts.
Drinking Water Supply
The Pohnpei Utilities Corporation is a government-owned organization responsible for supplying treated drinking water to Pohnpei’s residential, commercial and public facilities. The main water source for the region is the Nanipil River dam, located at the base of the mountains south of Kolonia. However, water shortages are frequent in Pohnpei, leading to the widespread use of wells and boreholes, especially during the dry season. Other challenges include surface and groundwater contamination resulting from inadequate management of wastewater. Additionally, the effects of climate change, such as rising sea levels, saltwater intrusion, and extreme weather events, are expected to impact the quality and availability of freshwater resources. Consequently, these changes may have implications for future drinking water supply.
Urban Roads & Transport
The road network in Pohnpei is relatively limited and primarily concentrated in and around the capital city of Kolonia. The urban roads in Pohnpei are generally paved and well-maintained,facilitating access to residential areas, commercial districts, government buildings, and tourist attractions. However, road infrastructure outside of urban areas tends to be less developed, with some roads being unpaved or in poorer condition. In terms of public transportation, Pohnpei offers a limited bus service primarily operating within Kolonia. Nonetheless, private vehicles are commonly used for transportation in and around Pohnpei. In the FSM, critical infrastructure including roads, faces risks from severe weather events and the effects of climate change. To address these challenges, the Department of Transportation, Communication & Infrastructure has formulated the Federated States of Micronesia Infrastructure Development Plan FY2016-FY2025. The plan aims to enhance the resilience of road and pedestrian infrastructure to climate change impacts while ensuring that transportation infrastructure adequately caters to both present and future demand.
Solid Waste Management
Solid waste management is a critical environmental challenge facing the state of Pohnpei. Despite urban growth, waste management infrastructure has failed to keep up with the rate of population increase. Consequently, waste is not being adequately collected and disposed of, posing risks to the environment and public health. In the FSM, the responsibility for solid waste collection lies with the municipalities, however in Pohnpei, a combination of public and private entities provides solid waste collection services to residents and businesses, with a fee based on factors such as volume, transport distance, and collection frequency. The current disposal method in Pohnpei involves utilizing the Dekehtik landfill site, which is considered unsuitable due to its encroachment into mangrove areas and its contribution to marine pollution through run-off. Approximately 50% of the waste generated in Pohnpei is disposed of at this site. To address these issues, the Pohnpei State Solid Waste Management Strategy (2020-2029) has been developed. This strategy aims to establish a technically sound and financially sustainable solid waste management system in Pohnpei.
Climate classification from Kottek et al’s 2006 Köppen-Geiger update. City Population, 2010. Micronesia Tour, n.d. Land Administration: Asian Development Bank, 2015; Department of Land, Pohnpei State, n.d. Housing: Asian Development Bank,2019. Energy: The World Bank, 2018; Asian Development Bank, 2019. Disaster Risk Management: Center for Excellence in Disaster Management & Humanitarian Assistance, 2022.
Key Considerations for Investment Planning & Prioritization
Concluding Questions
What is the most surprising result for you in this City Scan?
What patterns did this City Scan illuminate that you had not considered before?
What are your city’s critical development challenges?
What other information would you like in order to corroborate or amplify the information in this City Scan?
Who else would you like to speak with to gain further understanding about your city’s development challenges?
What investments need to be prioritized? What trade-offs are inherent in your prioritization?
What investments could be coordinated? What benefits would such coordination bring?