Kalemie, Democratic Republic of the Congo
Kalemie, Democratic Republic of the Congo
City Scan
October 2024
![]()
![]()
![]()
![]()
Executive Summary
Setting the Context
Kalemie is a city located in the southeastern region of the Democratic Republic of the Congo (DRC), positioned along the western shore of Lake Tanganyika. It serves as a key port and has rail connections to major cities including Lubumbashi and Kananga. The economy of Kalemie is largely based on agriculture and mining. However, the persistent instability in eastern DRC, intensified by ongoing armed conflicts, poses substantial challenges to its economic growth and sustainable development efforts.
Population and Demographic Trends
Kalemie has experienced consistent population growth since at least 1984, with an average annual increase of 1.2%. In 2004, at the time of the last census, the population was approximately 93,000. The city has a moderate population density compared to other regional cities in the Democratic Republic of the Congo, with a significant concentration of residents in the city center near the River Lukuga and Lake Tanganyika. These central areas are generally more affluent than the more remote neighborhoods located inland.
City Competitiveness and Economic Activity
Economic activity in Kalemie closely reflects the spatial distribution of wealth, which is primarily concentrated in the central districts, especially in the densely populated coastal areas. Additionally, there are some clusters of economic activity further north, perhaps associated with Kalemie Airport.
Built Form
Since 1985, Kalemie’s urban area has primarily expanded around the River Lukuga, which divides the city into two parts. During this period, the built-up area has grown by 43% from 8.3 km in 1985 to 12 km in 2015. Most of the land outside this developed region consists of grassland, followed by shrubland. Schools and healthcare facilities are well-distributed throughout the city.
Climate Conditions
Solar energy is moderately to highly available in Kalemie, particularly in the southern regions. However, the city suffers from poor air quality, with particulate matter levels exceeding WHO safety guidelines. Kalemie also experiences an inverse Urban Heat Island effect, resulting in lower surface temperatures in the densely populated central areas near the River Lukuga. While some northern parts of the city are rich in vegetation, significant deforestation has occurred in these areas between 2000 and 2023.
Risk Identification
Flooding is a moderate risk in Kalemie, especially pluvial flooding. Earthquakes, on the other hand, represent a significant risk in the region, with seven high-magnitude seismic events recorded since 1990, all occurring within 500 km east of Kalemie. While most of northern Kalemie has low susceptibility to landslides, this risk increases in the southern areas.
Local Institutions and Planning
The Constitution of the Democratic Republic of the Congo divides the nation into the capital city of Kinshasa and 25 provinces. Local administration includes various subdivisions such as cities, towns, and rural areas. Kalemie is governed by a Mayor elected by the city council and is organized into three communes: Kalemie, Lac, and Lukuga. The most recent National Development Strategy Plan (PNSD) aims for the DRC to attain middle-income country status by 2035 while promoting a diversified and inclusive economy driven by sustainable growth by 2050.Setting the Context
Basic City Information
Kalemie is a city situated in the southeastern part of the Democratic Republic of the Congo (DRC), located on the western shore of Lake Tanganyika. It serves as a major port and is connected by air and rail to key cities like Lubumbashi and Kananga. Kalemie’s harbor plays an important role in handling a significant portion of the country’s imports from Dar es Salaam in Tanzania, facilitating trade to Lubumbashi.
In addition to its port activities, Kalemie supports a small commercial fishing industry. The local economy is also driven by agriculture and mining, with a focus on copper, cobalt, gold, and tin. Additionally, light manufacturing plays a role in economic activities, with industries like cement production and food processing contributing to the region’s development.
Alongside the persistent conflicts that have afflicted the country for decades, Kalemie faces significant disaster risks, particularly from natural hazards like flooding and earthquakes. Seasonal flooding threatens local livelihoods and has threatened vital transportation networks necessary for trade and humanitarian aid delivery. The ongoing instability in Eastern DRC, exacerbated by armed conflicts, further complicates these risks, making recovery efforts more challenging and hindering sustainable development initiatives. As climate change continues to impact weather patterns, the frequency and severity of these disasters are expected to increase, posing additional threats to the region’s economy and community resilience.
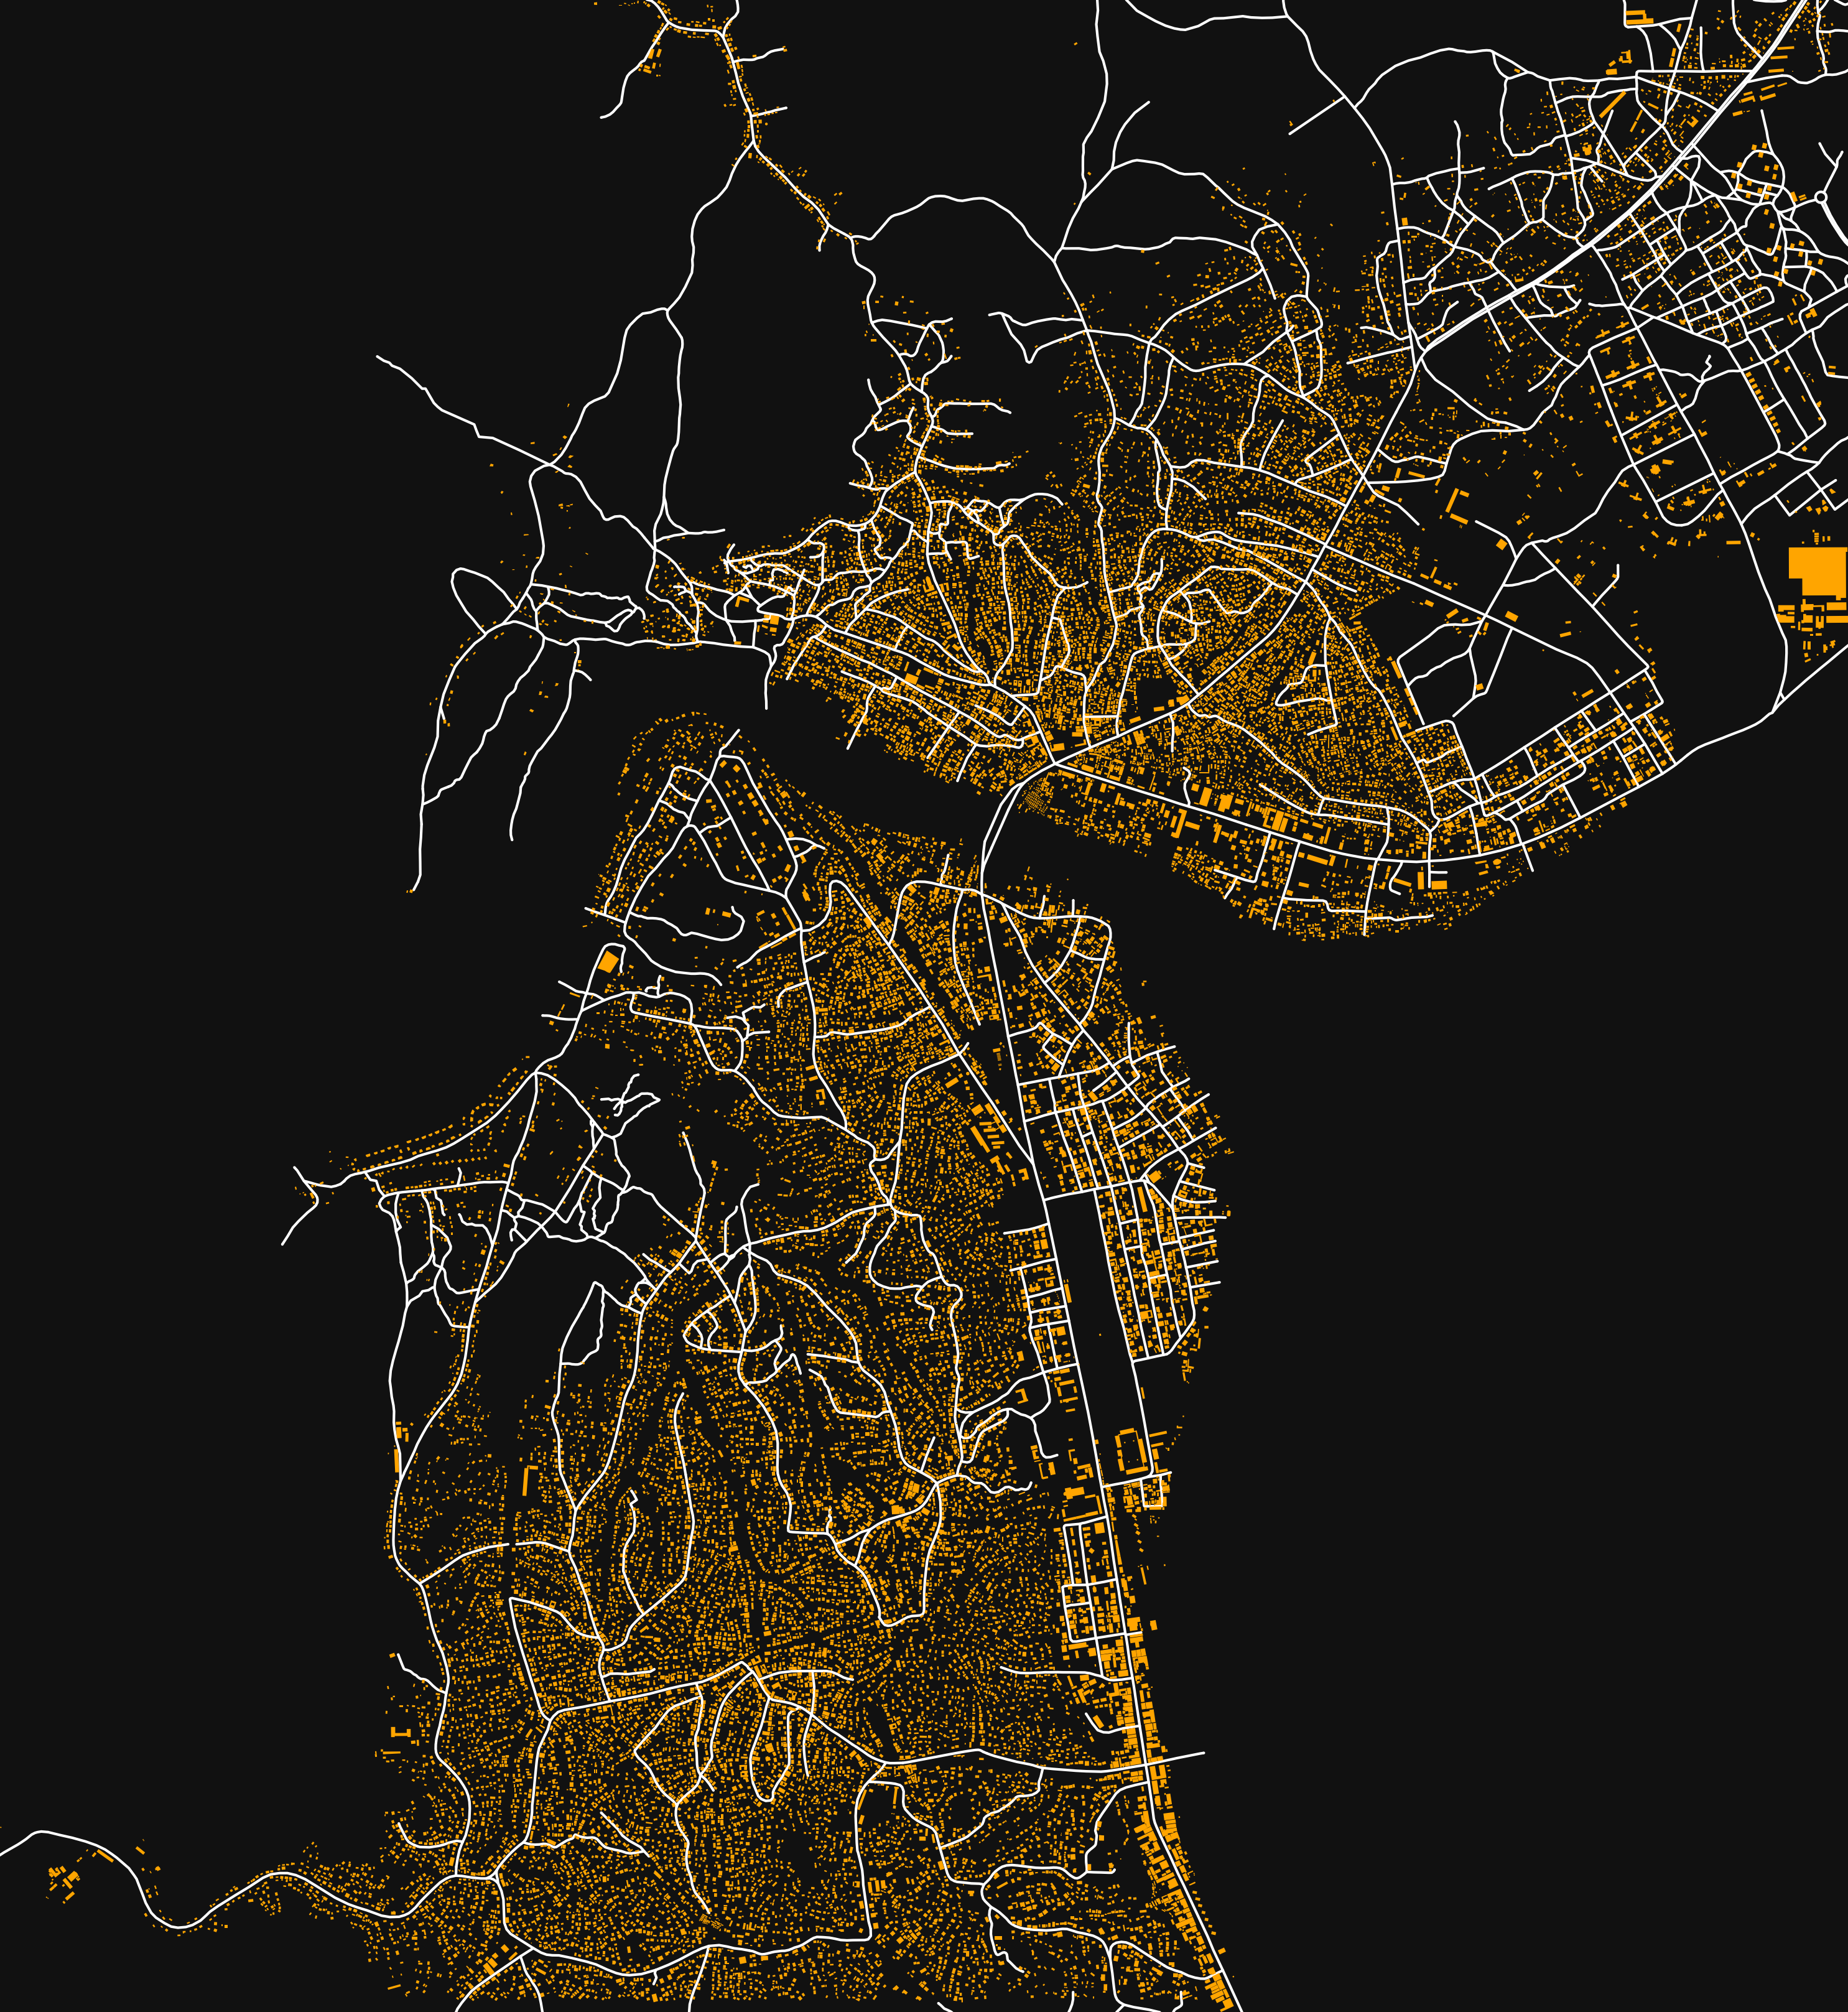
The black and yellow boundary marks the area of interest for the City Scan.
Population and Demographic Trends
Population Density
- Kalemie’s population density is lower compared to major cities like Kinshasa, Lubumbashi, and Mbuji-Mayi, but moderate or average for a regional city in the DRC
- Population density is highest in central Kalemie, particularly near the Lukuga River, and significantly decreases in peripheral areas such as Lufukwe and Moni
This map estimates population numbers per 10,000 m2 grid cell. It provides a more consistent representation of population distributions across different landscapes than administrative unit counts. Knowing where people are is critical for impact assessments and intervention plans, especially those focused on service delivery, food security, climate change, network systems and natural disasters.
Population Density
- With an area of 22 km2, Kalemie has a population density of 4,225 people per km2
- This density is comparable to that of Kipushi and Kamina
Density is calculated using the most recent census population recorded and the official land area occupied by the city, and is an important measure of how cities function. Higher population density enables governments to more easily deliver essential infrastructure and services in urban areas at relatively low cost per capita. However, such benefits do not materialize automatically or inevitably. Whether a city’s population dynamics pose challenges or offer opportunities typically depends on the policies in play.
Populations and area are from Oxford, 2022, “Oxford Economics” or CityPopulation.de. Note that Oxford Economics uses quite large extents for its cities, meaning that the measured density is likely considerably lower than the density experienced by most inhabitants of the cities. Extents used by the both data sources may differ from the AOIs used by the City Scans.
Population Distribution by Age & Sex
- Kalemie’s population is very young with two-thirds (66%) of people under 25, and one-third (35%) under 10
- Only 10% of people are 50 or older
- 50% are of working age
- There are more women than men, with a ratio of 95 men to every 100 women
- The two sexes have a similar age distribution
- 45% of all women in Kalemie are of reproductive age
This column chart classifies the city’s population according to age group, forming the basis of population projections. Populations vary significantly in their proportions of young and old people, with growing populations generally appearing younger, and declining or slowly growing populations generally appearing older.
Data from WorldPop. Bondarenko, et al, Estimates of total number of people per grid square broken down by gender and age groupings for 51 countries across sub-Saharan Africa in 2020 using Ecopia.AI and Maxar Technologies building footprints, 2020.
Reproductive age is defined as 15–49. Working age is defined as 15–64.
Relative Wealth
This map shows micro-estimates of wealth and poverty relative to the whole country that cover the populated surface at a 2.4 km2 resolution. Many critical policy decisions, from strategic investments to the allocation of humanitarian aid, rely on data about the geographic distribution of wealth and poverty.
Map data from Meta Data for Good.
Economic Activity
Economic Hotspots
- Economic activity in Kalemie shows a mixed pattern of growth and decline across different areas
- Areas currently experiencing high economic activity are showing signs of decline
- The area south of the airport appears to be experiencing the fastest growth
This map measures the total emissions of nighttime lights from the monthly average of radiance for 2014 through 2022. Nighttime light radiance is a common proxy for economic activity: where there is more artificial light, there is generally more commercial activity. VIIRS observations are made fairly late at night, as its satellites cross the equator at around 1:30 local time; thus, the observed lights are typically street lights and nights which are left lit all night long. The correlation of nighttime light and economic activity is strongest for urban areas; it is less relevant in agricultural areas and areas with very low population density.
Map data from NOAA, “VIIRS Daily Mosaic”.
Change in Economic Hotspots
- Economic activity appears to be increasing in the northern district of Baiyun.
- However, it appears to be declining in other densely populated areas, including Yunyan and some parts of Nanming.
The map illustrates monthly temporal changes from 2014 to 2022 in the emission of nighttime lights, indicating changes in economic activity. Positive values represent an increase in the intensity of nighttime light emission and, by proxy, economic activity, while negative values represent a decrease in the intensity of nighttime light emission, and economic activity.
Map data from NOAA, “VIIRS Daily Mosaic”.
Built Form
Urban Extent and Change
- The city’s built-up area grew from 8.3 km2 in 1985 to 12 km2 in 2015, reflecting a 43% growth
- The most rapid growth was in 1990 (~1 km2 or 11% growth)
- Since 1985, Kalemie’s built-up area has expanded primarily along the River Lukuga, which divides the city in two, and has extended southward toward the port
- Note that the discrepancy south of the airport between this map and the next is likely due to methodological differences between the two models; this area was likely developed before 2015
Map data from DLR, 2015, “World Settlement Footprint Evolution - Landsat 5/7 - Global”.
Land Cover
- Grassland is the largest land class and covers 67% of all land
- Built-up area is the next largest class, and comprises 17% of the land
- The next largest classes are tree cover and shrubland, especially in the north
Land cover refers to the ground surface cover, including vegetation, urban infrastructure, water, and bare soil, among other classifications. Identifying land cover type helps to understand land utilization and inform planning policies and programs.
© ESA WorldCover project 2020 / Contains modified Copernicus Sentinel data (2020) processed by ESA WorldCover consortium’
Access to Schools
Using a proximity analysis along the existing road network, this map identifies the areas that are most- and least-accessible to schools. The analysis includes all facilities classified in OpenStreetMap as a school, kindergarten, college or university. Note that there may be more schools that are not included in OpenStreetMap.
Map data from OpenStreetMap and DLR, 2015.
Access to Health Facilities
Using a proximity analysis along the existing road network, this map identifies the areas that are most- and least-accessible to schools. The analysis includes all facilities classified in OpenStreetMap as a health amenity, clinic, or hospital. Note that there may be more health facilities that are not included in OpenStreetMap.
Map data from OpenStreetMap and DLR, 2015.
Climate Conditions
Solar Photovoltaic Potential
- PV power potential in Kalemie is moderate to high
- With optimal conditions available for most of the year, the city can benefit from the development of solar energy projects to meet its increasing energy demands
- Solar power availability is highest in southern Kalemie
Solar electricity offers a unique opportunity to achieve long-term energy sustainability goals. Photovoltaics (PV) is the most widely applied and versatile technology for solar power. The availability of solar energy depends on site conditions. This map displays an indicative estimate of daily specific yield, that is, how much energy a hypothetical PV system would produce for per unit of capacity (kWh/kWp). Values above 4.5 are considered excellent availability, while values between 3.5 and 4.5 are moderate.
Map data obtained from the “Global Solar Atlas 2.0, a free, web-based application is developed and operated by the company Solargis s.r.o. on behalf of the World Bank Group, utilizing Solargis data, with funding provided by the Energy Sector Management Assistance Program (ESMAP). For additional information: https://globalsolaratlas.info
The Global Solar Atlas uses generalized theoretical settings for a quick assessment of PV power potential for a selected site. An optimum tilt angle of PV modules and 100% availability (no shutdowns due to failure) are assumed.
Air Quality
- Air quality in Kalemie is poor, with PM2.5 concentrations exceeding the WHO safety standard of 5 µg/m³ across the entire city
- The highest levels of air pollution can be found in the northwest region of the city
The concentration of particulate matter (PM) is a key indicator of air quality since it is the most common air pollutant affecting short and long-term health. This map displays the average annual concentration (µg per m3) of ground-level fine particulate matter of 2.5 micrometers or smaller (PM2.5).
PM2.5 particles are of greater concern than PM10 particles because their small size allows them to travel deeper into the cardiopulmonary system. According to the WHO and the United States EPA standards, PM2.5 concentrations should not exceed between 5 µg/m3 or 12 µg/m3, respectively. Higher concentrations of particulate matter may also reduce the availability of solar energy.
PM2.5 Grids are derived using annual data from 1998-2019 represent near-surface concentrations.
Map data from Hammer, 2022, “Global Annual PM2.5 Grids”.
Summer Surface Temperature
- Surface temperatures in Kalemie appear to exhibit a reverse Urban Heat Island (UHI) effect, with relatively lower temperatures found in the densely built-up and populated areas, while the less developed peripheral regions to the south tend to be hotter
Temperatures in an area are affected by many factors, such as land cover, elevation, slope, and proximity to water. Higher temperatures can generate or exacerbate negative effects related to health, social equity, and economic productivity. Typically, cities demonstrate higher temperatures than vegetated areas: construction materials, such as concrete, absorb more solar radiation; less vegetation results in less evapotranspiration; and more vehicle usage and mechanical cooling generate more heat.
This map shows average surface temperatures from June through September, 2014–2023, at a 30-meter resolution. Note that it measures surface temperature rather than ambient temperature, which can differ by several degrees. Surface temperature is primarily useful for identifying hotter and cooler areas within a specific geography.
Landsat Level 2 Surface Temperature Science Product courtesy of the U.S. Geological Survey.
Vegetated Areas
- The more populous and developed coastal areas have relatively less green space, although vegetation levels throughout the city range from low to moderate
This map displays the Normalized Difference Vegetation Index, which ranges between -1 and 1, with higher numbers indicating a higher density of green vegetation. Values of less than 0.1 typically indicate water, rock, and otherwise barren land; values of 0.1 to 0.3 are associated with shrubs and grassland; 0.3 to 0.5 corresponds to moderate vegetation; and values of more than 0.5 correspond to dense vegetation such as forests or mature crops.
Vegetation and green spaces in cities are associated with health benefits and the mitigation of environmental risks. More green space in a city can reduce temperatures and the urban heat island effect, lessen air pollution, and absorb floodwaters. Green spaces can also serve important civic, social, and quality of life functions.
Map data from European Space Agency, 2020, “Normalized Difference Vegetation Index”.
NDVI-based measures do not account for the proximity and spatial arrangement of green spaces within areal units. They also do not address the vertical dimension and density of green urban buildup.
Forests & Deforestation
- The forested areas are primarily located in the northern and inland regions of Kalemie
- However, since 2000, significant deforestation has occurred in these regions, as well as in some pockets further south
Loss of forest areas and wetlands in urban catchments contributes to a reduction in green land cover. As soils are then more likely to be saturated with water, more precipitation runs off, increasing the risk of flash flooding. Halting the loss and degradation of natural systems and promoting their restoration can therefore be critical.
Map data from Hansen/UMD/Google/USGS/NASA, at 1 arcsecond resolution. Trees are defined as vegetation taller than 5 meters.
Risk Identification
Infrastructure Assets Exposed to River Flooding
- 2% of major roads, 1 out of 4 police stations, and none of the 33 schools and 29 health facilities are located in a riverine flood risk zone with a minimum depth of 15 cm
Fluvial, or riverine flooding, occurs when excessive rainfall over an extended period of time causes a river to exceed its capacity. The damage from a river flood can be widespread as the overflow affects smaller rivers downstream, often causing dams and dikes to break and swamp nearby areas.
The infrastructure assets shown here are provided by OpenStreetMap. There may be other roads, health facilities, schools, fire stations and police stations that are not cataloged by OpenStreetMap.
Map data from OpenStreetMap and Fathom, “Flood Hazard: Global 2.0”. See Data Notes for more on the Fathom dataset.
OpenStreetMap data may not include all facilities.
Infrastructure Assets Exposed to Rainwater Flooding
- 9% of major roads, 1 out of 33 schools, 2 out of 4 police stations, and none of the 29 health facilities are located in a surface water flood risk zone with a minimum depth of 15 cm
Pluvial, or surface water flooding, is caused when heavy rainfall creates a flood event independent of an overflowing water body. It can occur in any urban area — even higher elevation areas that lie above coastal and river floodplains.
The infrastructure assets shown here are provided by OpenStreetMap. There may be other roads, health facilities, schools, fire stations and police stations that are not cataloged by OpenStreetMap.
Map data from OpenStreetMap and Fathom, “Flood Hazard: Global 2.0”. See Data Notes for more on the Fathom dataset.
OpenStreetMap data may not include all facilities.
Infrastructure Assets Exposed to River, Rainwater or Coastal Flooding
- 10% of major roads, 1 out of 33 schools, 2 out of 4 police stations, and none of the 29 health facilities are located in a riverine and surface water flood risk zone with a minimum depth of 15 cm
Many urban areas experience both fluvial and pluvial floods; places near rivers are preferred settlement areas, and a predominantly sealed urban surface prevents water infiltration, facilitating surface inundation. This problem is exacerbated in cities with insufficient or non-existent sewer systems.
The infrastructure assets shown here are provided by OpenStreetMap. There may be other roads, health facilities, schools, fire stations and police stations that are not cataloged by OpenStreetMap.
Map data from OpenStreetMap and Fathom, “Flood Hazard: Global 2.0”. See Data Notes for more on the Fathom dataset.
OpenStreetMap data may not include all facilities.
Urban Built-Up Area Exposed to River Flooding
- 10% of major roads, 1 out of 33 schools, 2 out of 4 police stations, and none of the 29 health facilities are located in a riverine and surface water flood risk zone with a minimum depth of 15 cm
The placement of assets in low-lying urban areas close to rivers has significantly intensified cities’ sensitivity to river floods.
Map data from DLR, 2015, and Fathom. See Data Notes for more on the Fathom
Urban Built-Up Area Exposed to Rainwater Flooding
- In 1985, 0.52 km2 of the city’s built-up area (6.2%) was exposed to surface water flooding
- By 2015 this area had increased to 0.8 km2 (6.7%)
- Proportionally, the area exposed to surface water flooding has stayed fairly constant
Tarmacked and paved surfaces, which limit water infiltration and increase the speed and amount of water running off the ground, lead to rainwater flooding in urban areas. This phenomenon is exacerbated by the alteration of natural drainage routes, resulting in reduced urban capacity for excess water.
Map data from DLR, 2015, and Fathom. See Data Notes for more on the Fathom dataset.
Urban Built-Up Area Exposed to River, Rainwater or Coastal Flooding
- In 1985, 0.57 km2 of the city’s built-up area (6.8%) was exposed to riverine and surface water flooding
- By 2015 this area had increased to 0.9 km2 (7.8%)
Intense rainfall in urban areas can generate both pluvial flooding due to the limited capacity of drainage systems, as well as fluvial flooding caused by deluges from river channels. The concurrence of pluvial and fluvial flooding often aggravates the damage potential they individually produce.
Map data from DLR, 2015, and Fathom. See Data Notes for more on the Fathom dataset.
Population Exposed to River Flooding
- 1.4% of Kalemie’s most populous areas (representing the two largest classes) are within the riverine flood risk zone with a minimum depth of 15 cm
Human settlements along streams and river basins are highly vulnerable to the flow of water. People are particularly sensitive to flooding in cases where population density is high, zoning regulations are absent or not enforced, flood controls are weak, and emergency response infrastructure and early warning systems are lacking.
Map data from WorldPop and Fathom. See Data Notes for more on the Fathom dataset.
Population Exposed to Rainwater Flooding
- 8.5% of Kalemie’s most populous areas (representing the two largest classes) are within the rainwater flood risk zone with a minimum depth of 15 cm
One consequence of increased population density in cities is an increase in impermeable surfaces, which leads to an increase in storm-water runoff.
Map data from WorldPop and Fathom. See Data Notes for more on the Fathom dataset.
Population Exposed to River, Rainwater or Coastal Flooding
- 8.9% of Kalemie’s most populous areas (representing the two largest classes) are within the riverine and rainwater flood risk zone with a minimum depth of 15 cm
When populations are exposed, vulnerable, dense, and ill-prepared, the effects of climate change on them are exacerbated along with the increased intensity and frequency of harmful flood events.
Map data from WorldPop and Fathom. See Data Notes for more on the Fathom dataset.
Elevation
- Kalemie’s topography is diverse, with higher elevations found in the southern area of the city, particularly in the southwest, as well as in certain areas further north
- Most of the built-up areas along the coast are located at approximately 755-825 meters above sea level
Elevation informs an area’s vulnerability to many natural disasters. The height at which infrastructure, resources, and communities sit relative to normal water levels and tides, flood waters, and storm surges and waves informs their exposure. Elevation information is critical for communities to anticipate the impacts of disasters and to prepare resilient and cost-effective response and redevelopment strategies.
Map data from FABDEM V1-2.
Slope
- Areas surrounding the Lukuga River and large expanses of land to the north are relatively flat, featuring a slope of less than 2° (3.5% grade)
- In contrast, southern Kalemie, as well as some areas further north feature slopes ranging from 5° to 20° (3.5% to 36% grade)
Slope refers to the percentage change in elevation over a certain distance. In hilly or mountainous areas, floods can occur within minutes after heavy rains, while in flat areas, floodwaters can remain for days. Considering the slope of land is important in reducing construction costs, extending services and public facilities, minimizing the risks of hazards like flooding and landslides, and mitigating the impacts of development on natural resources.
Map data from USGS, 2015, “USGS EROS Archive - Digital Elevation”.
Landslides
- Landslide susceptibility in Kalemie varies across different regions
- The northern areas, which are relatively flat, exhibit very low to low susceptibility to landslides
- In contrast, susceptibility increases in areas with steeper slopes, where moderate levels of risk are observed in several locations in the south
This indicator refers to the likelihood that a landslide will occur in a particular area based on local terrain conditions. It shows the degree to which a terrain can be affected by slope movements, i.e., an estimate of “where” landslides are likely to occur. Susceptibility does not, however, consider the temporal probability of failure (i.e., when or how frequently landslides occur), nor the magnitude of the expected landslide (i.e., how large or destructive the failure will be).
This map combines satellite observations of rainfall with an assessment of the underlying susceptibility of the terrain. Steep slopes are the most important factor in a landscape’s susceptibility to landslides. Others include deforestation, presence of roads, strength of the bedrock and soils, and location of fault lines.
Map data from NASA, “Landslide Susceptibility Map”.
Significant earthquakes
Liquefaction
- Liquefaction susceptibility varies throughout Kalemie
- Areas north of the Lukuga River exhibit moderate to high levels of susceptibility, while regions south of the river show lower susceptibility
- This pattern does not indicate a correlation between urban development and liquefaction risk in Kalemie
While all of the city has the same likelihood of seismic activity, areas within a city will typically have differing levels of vulnerability, due to factors such as soil and building construction. Liquefaction is a phenomenon where loosely packed or waterlogged sediments, particularly beneath buildings and under structures, lose their strength in response to strong ground shaking. Liquefaction in the event of an earthquake can cause increased damages.
This map calculates the likelihood of liquefaction using a combination of indicators such as peak ground velocity, precipitation and others. Each level determines a threshold of confidence regarding the probability of liquefaction in the particular pixel area.
Map data from Zorn & Koks, 2019.
roads
- The most vital sections of the city are located along the N5 highway, which runs vertically through Kalemie
This layer visualizes an approximation of road network criticality. It highlights segments within a road network that, if blocked due to flooding or other hazards, would cause a high degree of disruption to travel across the city. Segments in red are the most critical for the overall connectivity of the city.
Note that cities vary substantially in their probability of disruption due to failure of a small number of road segments; for example, when a street network follows a grid pattern or has many alternative routes between destinations, the risk of disruption owing to the failure of key road segments is lower. In contrast, other cities have particular road segments whose failure would affect a large proportion of journeys across the city.
Map data from OpenStreetMap.
Criticality is measured by calculating betweenness for each segment. Betweenness for a segment is calculated by mapping the shortest path from each intersection to every other intersection, and then taking the percentage of all trips that use that segment.
Burnable Area
- Most of the inland peripheral regions where significant cropland is found, are characterized by highly flammable land cover types
- The presence of these burnable land cover types suggests an increased susceptibility to wildfires
This layer visualizes the burnability factor of each land cover classification, based on assigning a binned weighting factor to represent burnability of each land classification. As per Four Twenty Seven’s research and Gannon and Steinberg’s (2021) research, global trends in historical wildfire intensity and occurrence of wildfire in each land cover classification is converted into a single burnability factor.
© ESA Land Cover CCI 2020/ Gannon et.al 2021
Local Institutions & Planning
Administrative Structure
- Kalemie is governed by a Mayor who is elected by the city council
- The mayor oversees a range of essential services, including infrastructure development, healthcare, and education
- The city itself is divided into three communes: Kalemie, Lac, and Lukuga
- Each commune has its own local government structure, featuring a burgomaster (mayor) who is also elected by the local council
Availability Of Development Plans And Policies
- The DRC’s most recent National Development Strategy Plan (PNSD) aims to achieve middle-income country status by 2035 and to develop a diversified, inclusive economy driven by sustainable growth by 2050
- The DRC adopted its most recent National Action Plan (NAP) in 2018 for the period 2019-2022; however, there has been no update since then
- In October 2023, the National Assembly passed the country’s first-ever legislation on land-use planning, but currently, only seven cities have established urban planning instruments
- Additionally, some provinces have developed their own Provincial Development Plans to localize the country’s Sustainable Development Goals.
The State of Urban Infrastructure and Service Delivery
Land Administration
The DRC’s land administration system combines formal state ownership with customary tenure practices, but faces significant challenges. Land remains a major source of conflict due to insecure land rights, conflicts between formal and customary systems, weak administration, displacement-related land disputes, limited land registration, and corruption. To address these issues, the government has launched reform initiatives including the Land Tenure Reform Programme (PARF), the National Land Reform Commission (CONAREF), and a National Land Tenure Policy. These efforts aim to clarify rights, reduce conflicts, and establish a more stable and equitable system. In 2023, the government adopted a National Land Policy and developed a new Land Tenure Law. The government is currently piloting reforms in Ituri province, where local land tenure security arrangements have been strengthened and over 100 land conflicts have been resolved using alternative dispute resolution methods.
Energy
Hydropower constitutes approximately 96% of the DRC’s energy supply, yet there is a pressing need to diversify by investing in wind and solar energy. Despite the country’s vast energy resources, in 2016, only 47% of the urban population had access to electricity, while a mere 1% of rural households were connected. The Inga I and II dams, crucial for the national energy supply, have suffered from decades of neglect, which has significantly limited their output. To tackle these issues, the DRC government is implementing reforms that include rehabilitating existing infrastructure and constructing the Inga III dam. Furthermore, international initiatives like Power Africa are working to improve energy access and infrastructure through strategic partnerships and investments.
Housing
Kalemie is grappling with a serious housing crisis driven by conflict, displacement, and the impacts of climate change. In Tanganyika Province, around 367,000 people remain displaced, facing inadequate shelter and struggling to meet their basic needs. The situation is worsened by frequent flooding, which has severely damaged homes and infrastructure in Kalemie in recent years. Since 2018, UN-Habitat and other organizations have taken steps to address these challenges through land reform and conflict mediation. These efforts have benefited approximately 110,580 individuals by resolving land disputes. However, critical challenges remain: the large displaced population in Tanganyika Province continues to overwhelm available housing, and many lack the resources to rebuild or secure safe housing. There is an urgent need for affordable housing solutions to support vulnerable and displaced communities, along with resources and assistance for rebuilding efforts.
Disaster Risk Management
The DRC is vulnerable to various hazards, including volcanic eruptions, earthquakes, flooding, and drought. This vulnerability is intensified by poverty, political instability, and the impacts of climate change, which are expected to increase the frequency and severity of natural disasters. Disaster risk management (DRM) in the DRC is primarily coordinated by the National Commission for the Rehabilitation of the Disaster-Affected, as outlined in the country’s Disaster Relief Organization Plan (ORSEC). Currently, the DRC government is collaborating with the United Nations Development Programme (UNDP) to develop its first disaster risk reduction policy, which incorporates climate adaptation into its Poverty Reduction Strategy. Key priorities for enhancing DRM include improving hazard monitoring and forecasting, strengthening early warning systems, and building institutional capacity for effective disaster management.
Drinking Water Supply
Despite the country’s abundant freshwater sources, only 52% of the DRC’s population has access to improved water sources. In Kalemie, many residents depend on boreholes or informal water vendors, or draw untreated water directly from Lake Tanganyika. The arrival of internally displaced people, driven by inter-community violence since November 2016, has further increased demand on local water systems, straining resources for host communities. Overcrowding and poor living conditions have contributed to the spread of cholera, which is now endemic in the region. Since 2008, international organizations, including SOLIDARITÉS INTERNATIONAL, along with UNICEF in recent years, have been working to restore and improve Kalemie’s drinking water network as part of the national strategy to eliminate cholera. However, ongoing challenges highlight the need for continued investment and support to ensure sustainable access to clean water for all residents.
Urban Roads & Transport
The road network in the DRC is in poor condition due to years of armed conflict. It includes approximately 58,358 km of national roads, 86,615 km of rural roads, and 7,400 km of urban roads. However, only about 5% of the national roads are paved, primarily along key routes such as those between Matadi and Kinshasa and Lubumbashi towards the Zambian border. Kalemie is connected by a railway line to Kindu and Lubumbashi, but this service is often unreliable due to poor maintenance of tracks. Additionally, Kalemie has access to domestic waterways on Lake Tanganyika, linking it to Kalundu-Uvira. While specific details on urban transport in Kalemie are scarce, it can be inferred from broader trends in the DRC that public transportation options are limited and largely unregulated.
Solid Waste Management
Many urban areas in the DRC face challenges with solid waste management. Rapid urbanization in the country’s cities has not been accompanied by adequate waste management services, resulting in increased waste production without proper disposal methods. For example, many DRC cities lack essential waste management infrastructure, such as transfer stations, recycling facilities, and sanitary landfills. This poor waste management leads to significant social, environmental, and health problems. Kalemie likely experiences similar issues, given its struggles with waterborne diseases like cholera. Without formal waste management systems, residents may resort to informal disposal methods, such as street dumping or incineration, as seen in other DRC municipalities.
Local Administration
The DRC is structured as a unitary state with a multi-tiered hierarchy of administrative divisions. The constitution divides the country into the capital city of Kinshasa and 25 provinces, granting the capital the status of a province. Each province is governed by its own provincial assembly and governor, a system established through constitutional reforms in 2006 aimed at decentralizing power. The local administration encompasses various subdivisions, including cities, towns, and rural areas, many of which are governed by appointed officials rather than elected representatives. This system has led to a significant role for traditional authority in local governance, where traditional leaders often influence decision-making processes within their communities.
Land administration: CAFI, N.D.; GLTN, N.D.; USAID, N.D. Housing: Center for Affordable Housing, N.D.; UN-Habitat, N.D. Energy: Low Carbon Power, 2022; Sustainable Energy for All, N.D. Disaster Risk Management: UNEP, 2022; The World Bank, N.D.; Climate Change Laws of the World, N.D. Water: AFD, 2022; Pavot, Luc, 2017; SOLIDARITES INTERNATIONAL, 2015. Solid Waste Management: Okin Kang, Y. et al., 2023. Roads and Transport: Logistics Cluster, N.D.; Wikipedia, N.D. Local Administration: Henn, Soeren et al. 2023; Wikipedia, N.D.
Key Considerations for Investment Planning & Prioritization
Concluding Questions
What is the most surprising result for you in this City Scan?
What patterns did this City Scan illuminate that you had not considered before?
What are your city’s critical development challenges?
What other information would you like in order to corroborate or amplify the information in this City Scan?
Who else would you like to speak with to gain further understanding about your city’s development challenges?
What investments need to be prioritized? What trade-offs are inherent in your prioritization?
What investments could be coordinated? What benefits would such coordination bring?